|
DMagic is an open-source Python toolbox to perform data management and data sharing for users of the Imaging Group of the Advanced Photon Source. Data collection at the Advanced Photon Source (APS) can generate massive amount of data and often the beamline staff can be overwhelmed by routine data management tasks like sharing, distributing and archiving.
DMagic aims to provide easy command-like instruction to automate the majority of beamline scientist data management tasks. The toolbox has been developed to support the APS Imaging Group data management activities but it can be easily adopted and implemented at any APS beamline.
DMagic relies on automatic access to the APS scheduling system and makes extensive use of Globus. Basic functionality include the ability, for a given experiment date, to retrieve the users’ email addresses from the APS scheduling system and automatically send an e-mail to the users containing a link (drop-box style) to retrieve the data from a globus server or globus personal endpoint.
Other functionalities include monitoring a directory and copy any new files to a globus connect personal and/or remote server endpoints. Data can be shared directly from the beamline machine or from a Globus server.
|
|
CMPR is a general purpose powder diffraction visualization tool. It also provides many data reduction tools for initial analysis, such as peak fitting, autoindexing, unit cell display. Windows/Mac/Linux.
Contact: Brian Toby
|
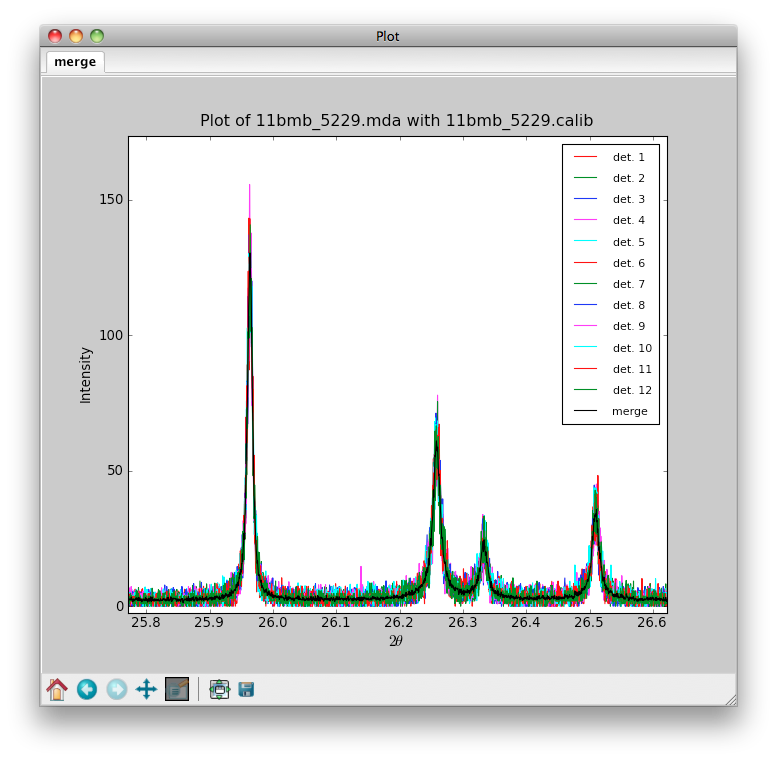
Data Merge
The data from 11-BM must be corrected for 2theta zero, detector sensitivity and minor differences in wavelength before merging into a single compositepattern. This is usually done at the beamline, but users can install a version of the Python tool on their home computer for specialized use. Limited instructions are provided inside the archive. Platform independent.
The Data Merge code is available for download as a .
Contact: Brian Toby
|
|
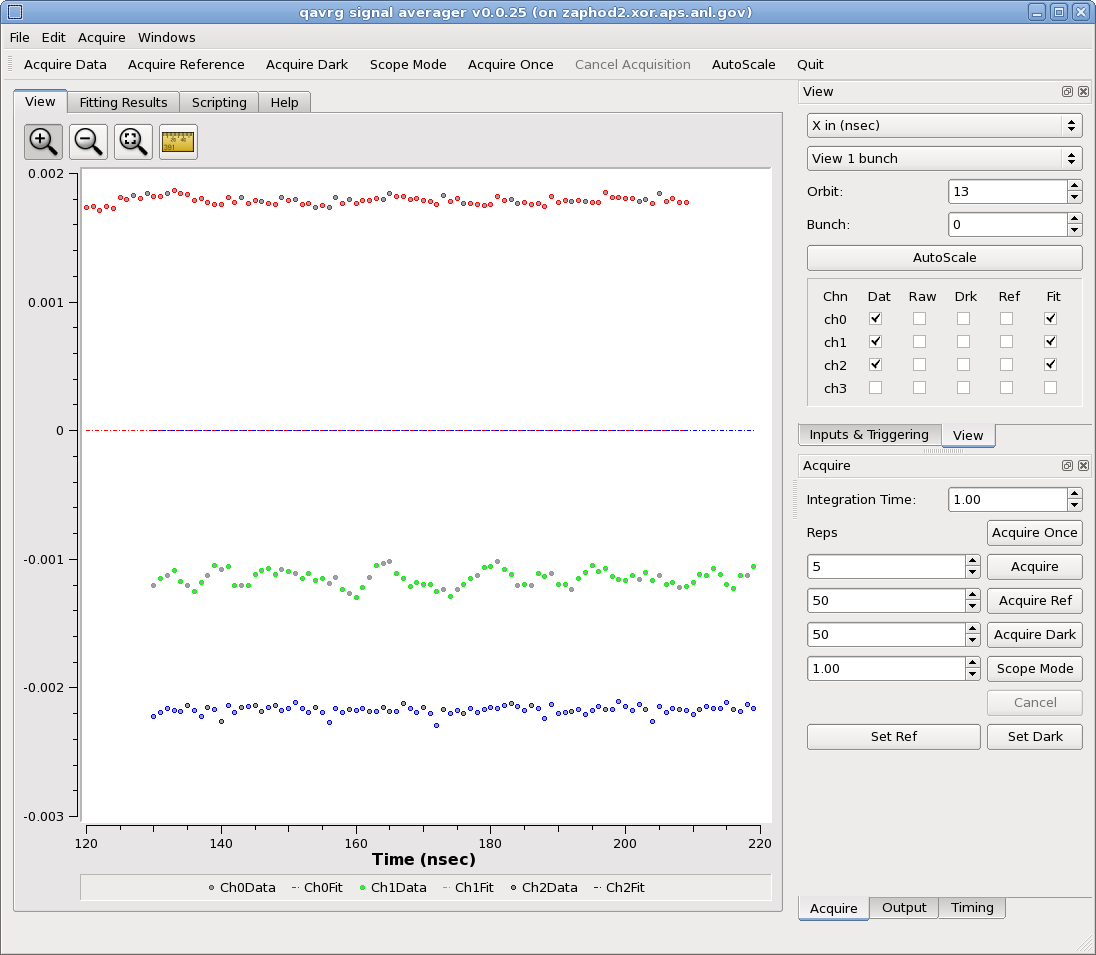
QAVRG is an application intended to allow ultra-high time resolved EXAFS experiments using ultrafast detectors and an Acqiris signal averager card. Though primarily intended for data acquisition it can also be used for offline data analysis. It is written in C++ using the Qt toolkit. Prebuilt versions are available for Fedora Linux.
Contact: Guy Jennings
|
|
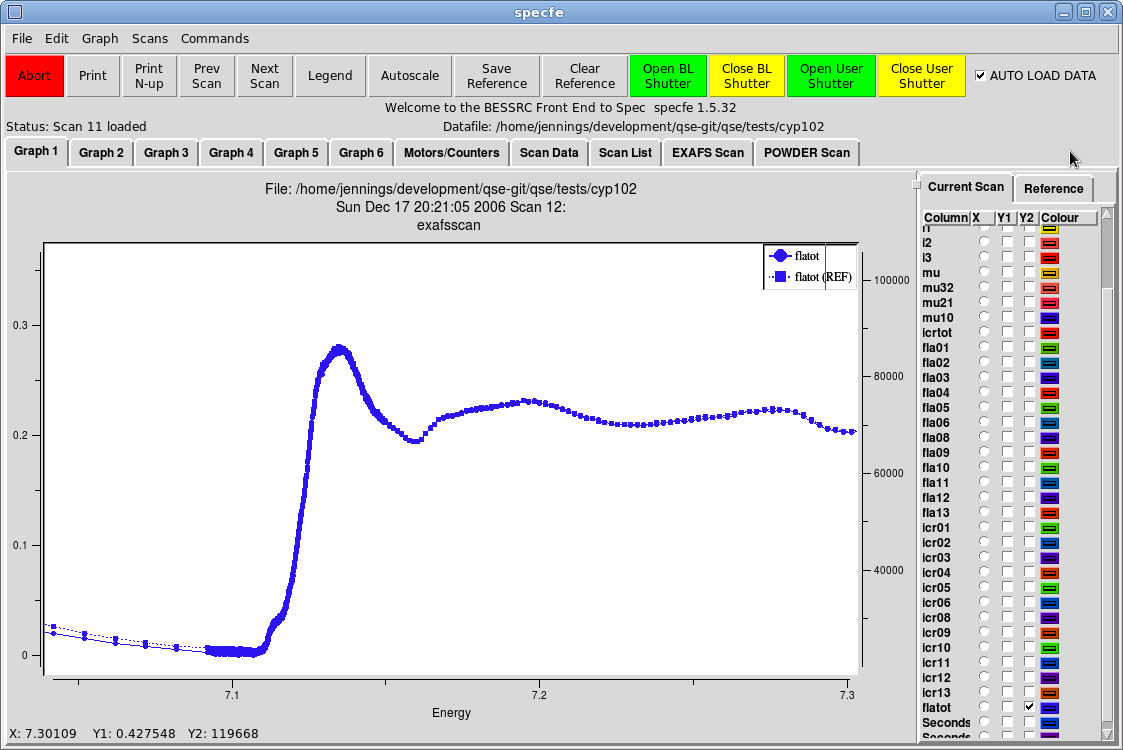
Specfe is a graphical front end program intended to aid the use of the 'spec' data acquisition software. Specfe is able to display interactive graphs of data scanned by spec, to present a user-friendly graphical interface to several of the more common spec commands and to present a unified 'tweaking' interface to the spec motors and counters.As well as interfacing to spec, specfe can also run in a stand-alone mode where it may be used to browse 'spec' data files. Specfe is written in tcl/tk and is available pre-built for Fedora Linux.
Contact: Guy Jennings
|
|
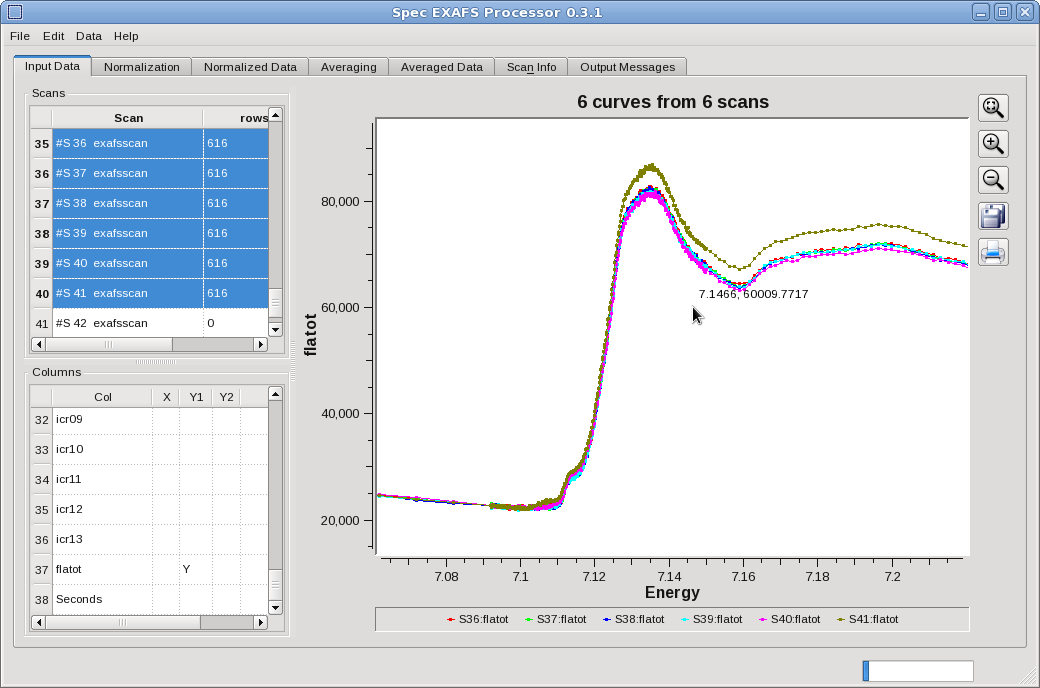
QSE is an application intended to help in the initial stages of data reduction of EXAFS data taken with multi-element detectors using the 'Spec' data acquisition system. The program allows you to read in a data file, decide which scans to use and which data columns to use from each scan, add together and normalize the data from individual detector elements and average together groups of scans. Data at various stages of processing may be displayed, printed and/or saved in new data files. Versions are available for Linux, Windows and Mac OS X.
Contact: Guy Jennings
|
|
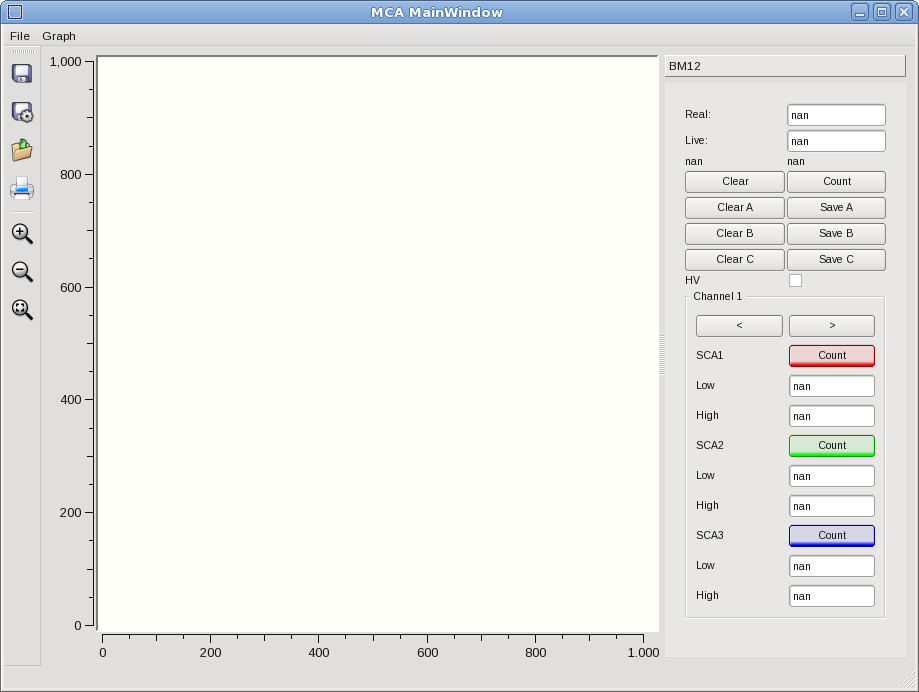
QMCA is an application to visualize data from and control epics-based multichannel analyzer systems. QMCA is written in C++ using the Qt toolkit. Prebuilt versions are available for Linux.
Contact: Guy Jennings
|
|
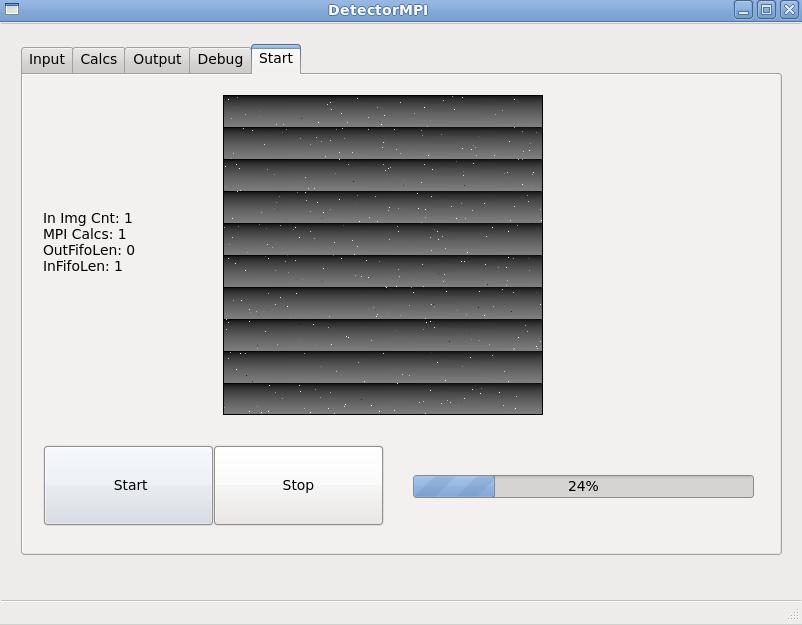
DetectorMPI
Detector MPI is a QT and MPI-based graphical application for performing real-time processing of detector data. The software performs dark image integration and background subtraction in real time using the MPI library as images stream from the detector.DetectorMPI is intended to be a template for the development of real-time processing on streamed detector image data. DetectorMPI reads data from a Linux pipe and scatters images to any number of processes running on multiple cores.Dark images can be integrated in real time, with each process performing a partial integration, to compute an averaged dark image. This dark image is subsequently used in background subtraction, again done in real time on multiple cores, before all computed images are gathered, displayed, and streamed to an output Linux pipe. Alternatively, DetectorMPI can save data as TIFF files. A version of DetectorMPI is in use at APS Sector 8 for real-time compression of XPCS data collected by the Fast CCD detector. More information can be found in Madden, et. al. “Real-Time MPI-Based Software for Processing of XPCS Data,” IEEE Nuclear Science Symposium Conference Record, Seattle, WA, Nov. 8-15, 2014.
Authors: Timothy Madden, John Weizeorick, Alec Sandy, Suresh Narayanan, Sufeng Niu
Acknowledgments: Peter Denes, John Joseph, Victoria Moeller-Chan, Dionisio Doering, Patrick McVitte (Lawrence Berkeley Laboratory)
Contact: Timothy Madden
|
|
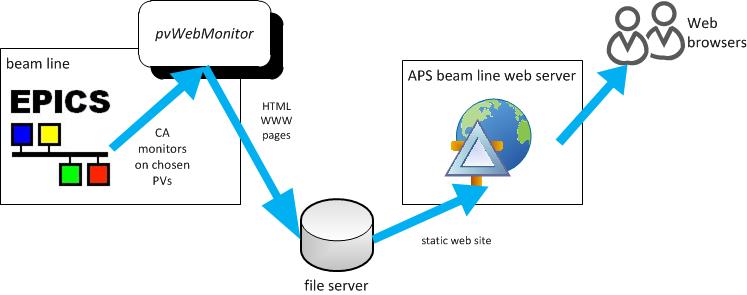
pvWebMonitor
This package provides an EPICS background service that monitors Process Variables and writes them into customized HTML files in a WWW server directory. The service can be started and stopped by a command shell script for automated start-up in a periodic (cron) task or at system start-up.
This package can be installed from the Python Package Index using the command:
pip install pvWebMonitor
It is installed on most APS beamlines in the APSshare versions of Python. Links: project and documentation.
Contact: Pete R. Jemian
|
|
pvMail
The pvMail package was built to watch (monitor) an EPICS PV and send an email when the value of that PV changes from 0 to 1.
The PV being watched (that triggers the sending of the email) can be any EPICS record type or field that results in a value of 0 (zero) that changes to 1 (one). This includes these EPICS records (and possibly more): ai, ao, bi, bo, calcout, scalcout, swait, ...
When an event causes an email to be triggered, PvMail will retrieve the value of another PV that is the first part of the message to be sent. Additional metadata will be appended to the message.
This package is installed on most APS beamlines in the APSshare versions of Python or it can be installed from the Python Package Index using the command:
pip install pvMail
Links: project and documentation.
Authors: Pete R. Jemian and Kurt A. Goetze. Contact: Pete R. Jemian
|
|
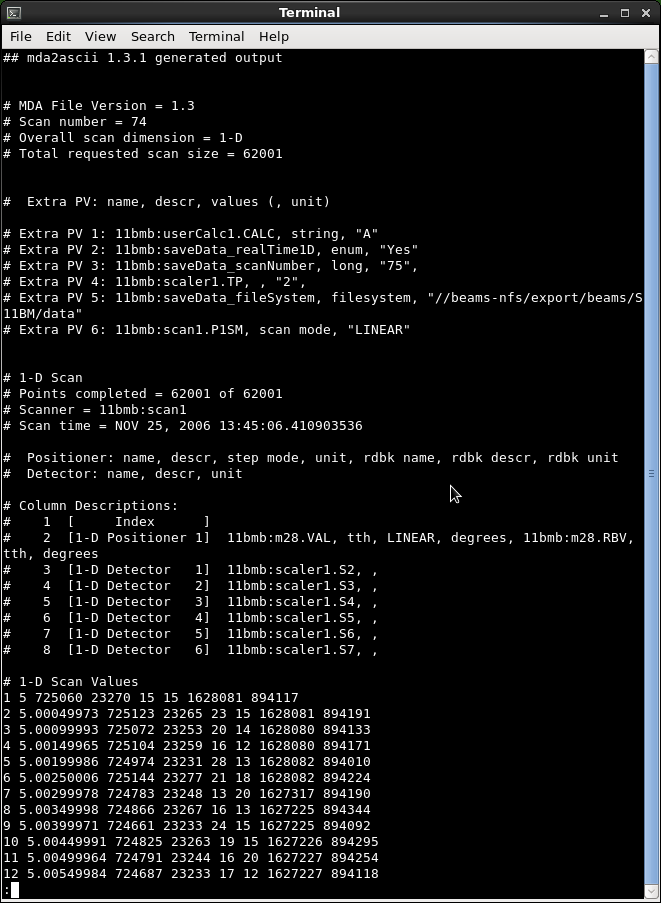
MDA Utilities
This set of command line programs allows one to work with the binary MDA data files that EPICS "saveData" writes. The most commonly used program (mda2ascii) converts MDA files to ASCII output and has many options.
There are four other programs:
- summarizes the contents of MDA files in a directory
- displays the details of an MDA file (but shows no data)
- dumps the contents of an MDA file in case there is an error
- for a directory tree containing MDA files, creates a mirror tree containing ASCII converted files.
There is also a C library included that can be used for accessing MDA data directly in a program.These utilities can be downloaded as code (which easily builds on Linux and MacOS X), or as binaries for Linux, MacOS X, and Windows.
Contact: Dohn Arms
|
|
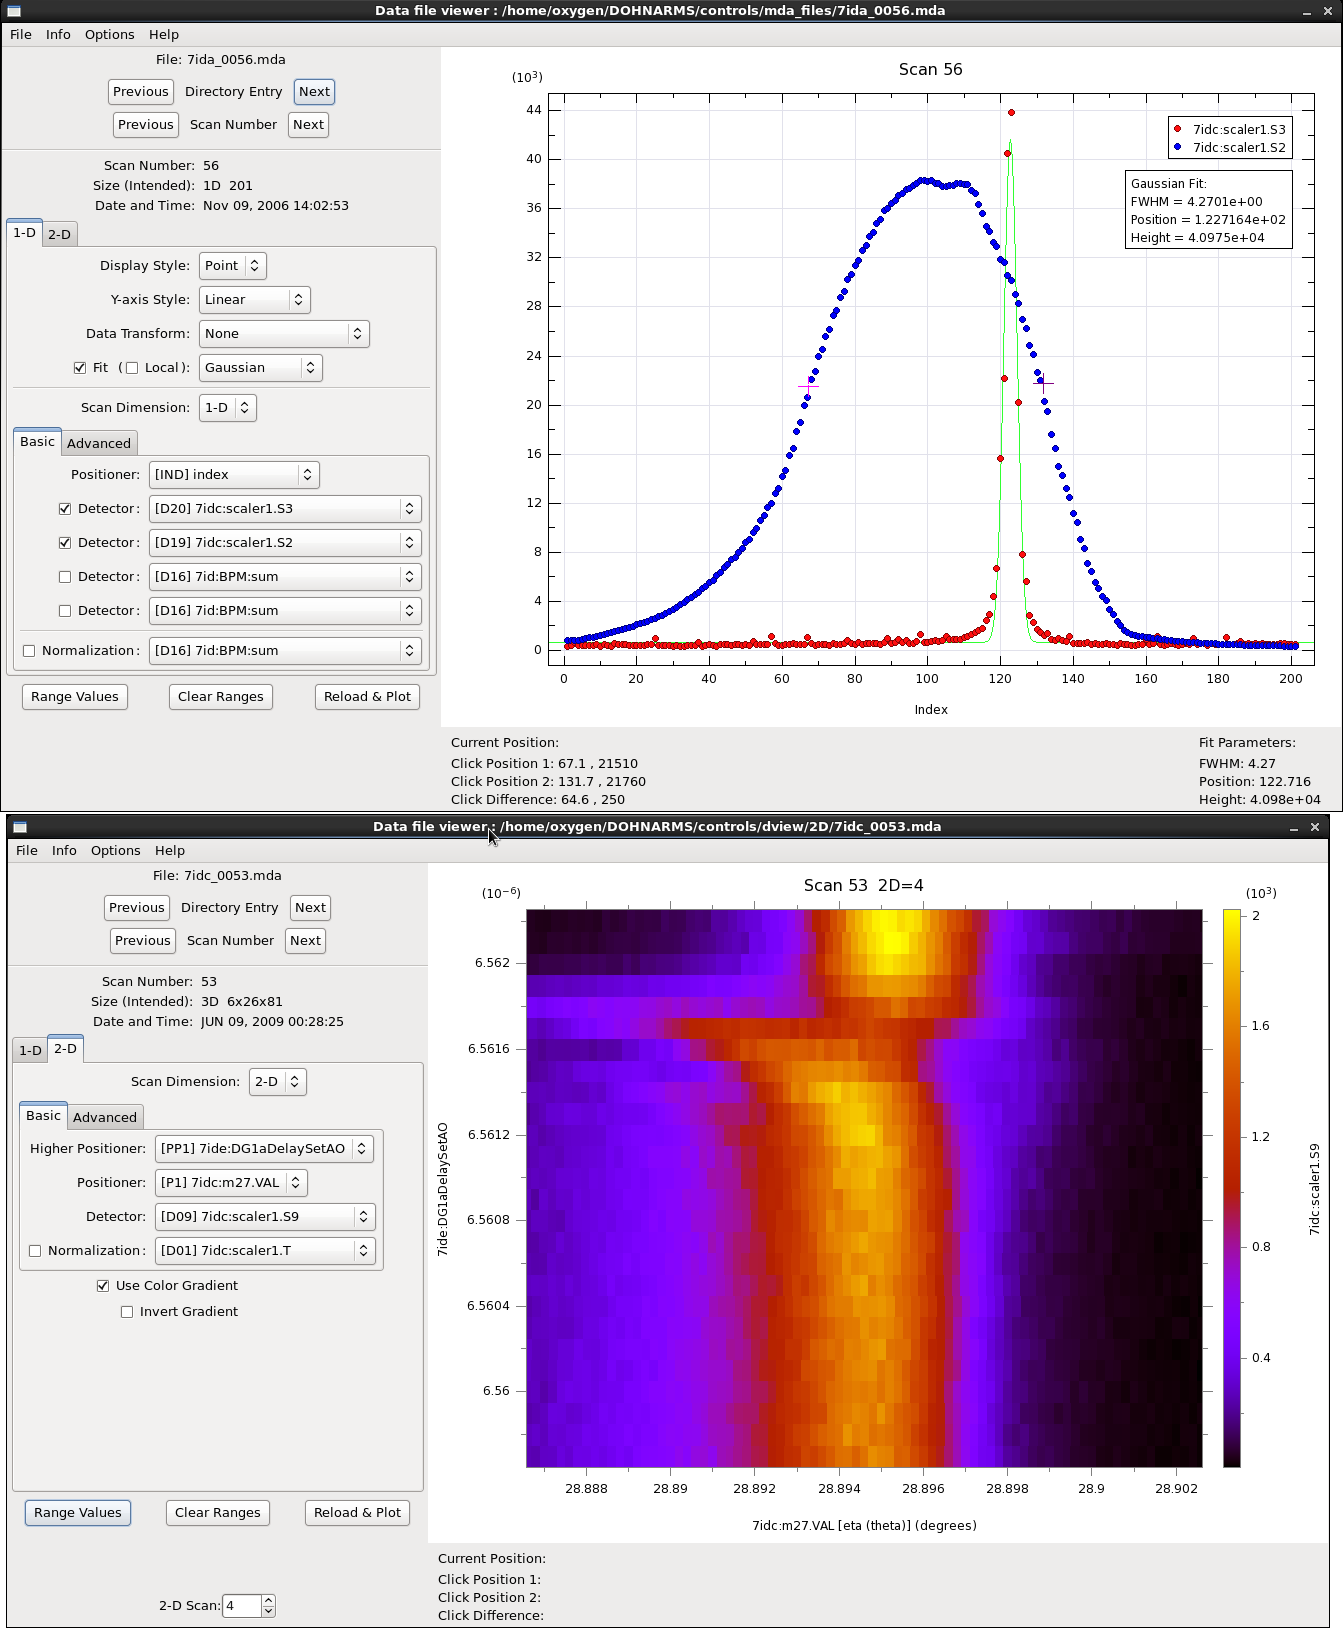
dview
This program allows viewing the binary MDA data files created by EPICS "saveData".It can generate both 1D and 2D plots. There are options for fitting and data transformation expressions, but they are kept simple as this program is really only meant for viewing data (not analysis).It does not talk to EPICS, but it can be refreshed on an active file to simulate watching live data. Plots can be saved as PDF, PNG, and Postscript.Data files containing the values as plotted can be generated (with any fit values).
Contact: Dohn Arms
|
|
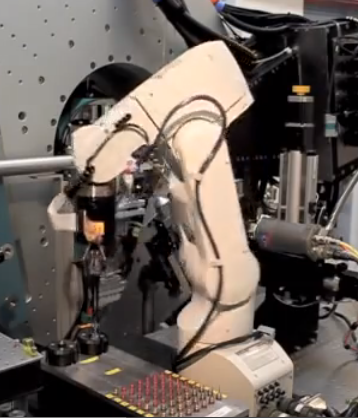
11-BM Mail-in Automation Software
To provide metadata management and automate the processes needed for data collection of samples mailed into 11-BM, a series of PHP and Python scripts have been written that integrate with the APS proposal, ESAF and scheduling databases to perform the following workflow: (1) request of sample mounting kits by users with subsequent cataloging of their barcode numbers to proposals and user e-mail addresses; (2) user input of sample information, including hazards; (3) recording receipt of samples, generating e-mails to users; (4) automation of data collection; (5) instrument calibration; (6) data reduction, with quality-control oversight and e-mail notification when data are available; (7) user-driven data retrieval; (8) recording of short-term sample storage; (9) assisted disposal or return of samples; (10) automatic polling of users to track of publication outcomes.
This code is highly customized to 11-BM hardware and workflow, but the process description (see Toby, et al, J. Appl. Cryst. (2009), 42, 990-993, doi:10.1107/S0021889809035717) will be of value to anyone implementing a mail-in process for a beamline.
Author: Brian H. Toby. Contact: Saul Lapidus.
|
|
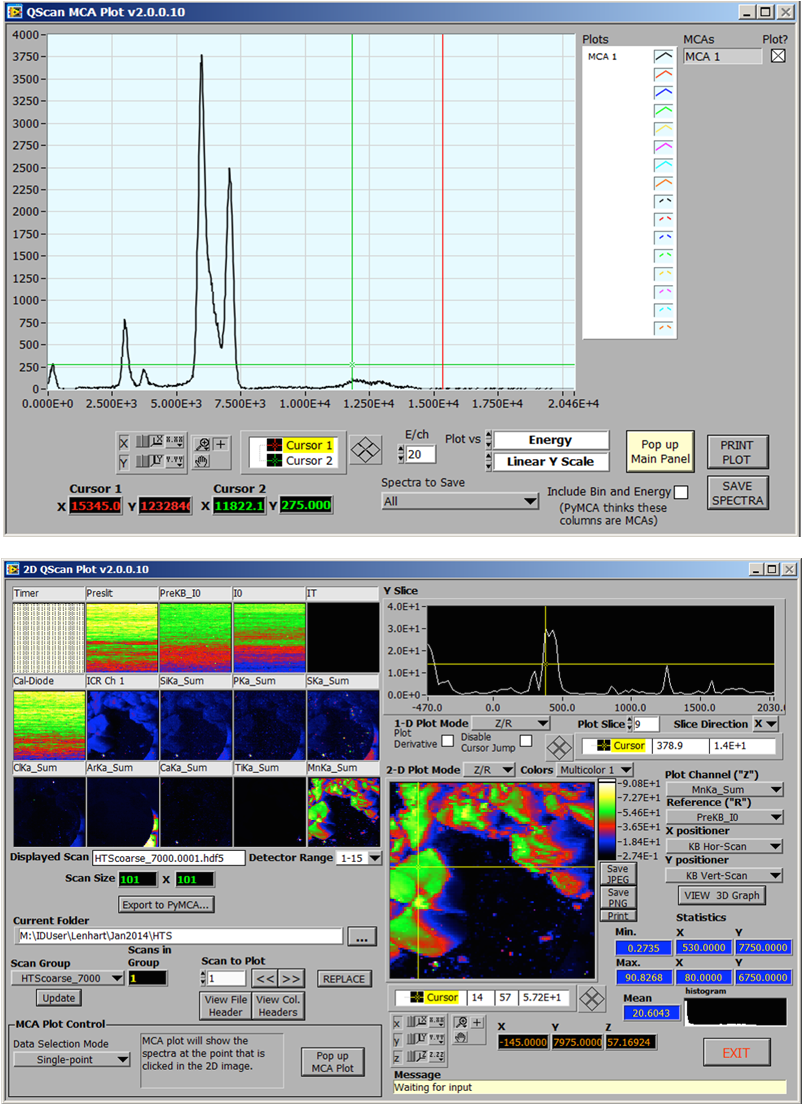
SPC Data Plotting Tools
Visualizing data as it is collected at the SPC beamlines (20BM, 20ID, and 9BM) greatly benefits users. These tools have a consistent user interface and allow quick and easy visualization and preliminary analysis for all supported experiments, including XAFS, 2D mapping including full MCA spectra, and RIXS. New data sets can be added to plots and plots can be easily exported.
- 1-D Scan Plot can plot XAFS data as well as general 1D scans, for example in sample alignment. Scans can be easily added, and simple XAFS data processing can be performed. Averaging, adding and subtracting of scans, plotting derivatives, and calculation of basic scan statistics are also provided.
- 2-D Scan Plot can plot 2D maps from the 20ID microprobe, as well as from general 2D scans. Data from each detector (ion chambers, SSD ROIs, as well as general epics “detectors”) is plotted in a thumbnail-like display. A larger plot displays a particular detector normalized to another with options for normalization ratio (e.g. linear or log). Slices in either image direction can be displayed, with an option to plot the displayed slice’s derivative. Images can be exported to JPEG or PNG with selectable color map.
- 1-D and 2-D QScan Plotadds the capability to plot full-spectrum MCA data collected at each point in a scan vs 1-D Scan Plot and 2-D Scan Plot.MCA spectra are displayed in a separate window with various plotting options. Spectra from either a particular scan point, or spectra summed over a region of interest in the map, can be chosen and plotted and exported. Spectra from an entire 2D map (or ROI) can be exported, allowing for PyMCA batch fitting.
- RIXS PLOT visualizes RIXS data from SPC MiniXES spectrometers (Pilatus 100K detectors), displaying data in either Emission Energy or Energy Transfer coordinates. Multiple scans can be easily added and summed, and slices in either the incident energy or emission/transfer directions can be plotted, with selectable binning. RIXS data from single or multiple scans can be batch-processed from a simple GUI that provides a front end to our Python script for RIXS processing (developed by former University of Washington student Brian Mattern.)
Contact: Dale L. Brewe
|
|
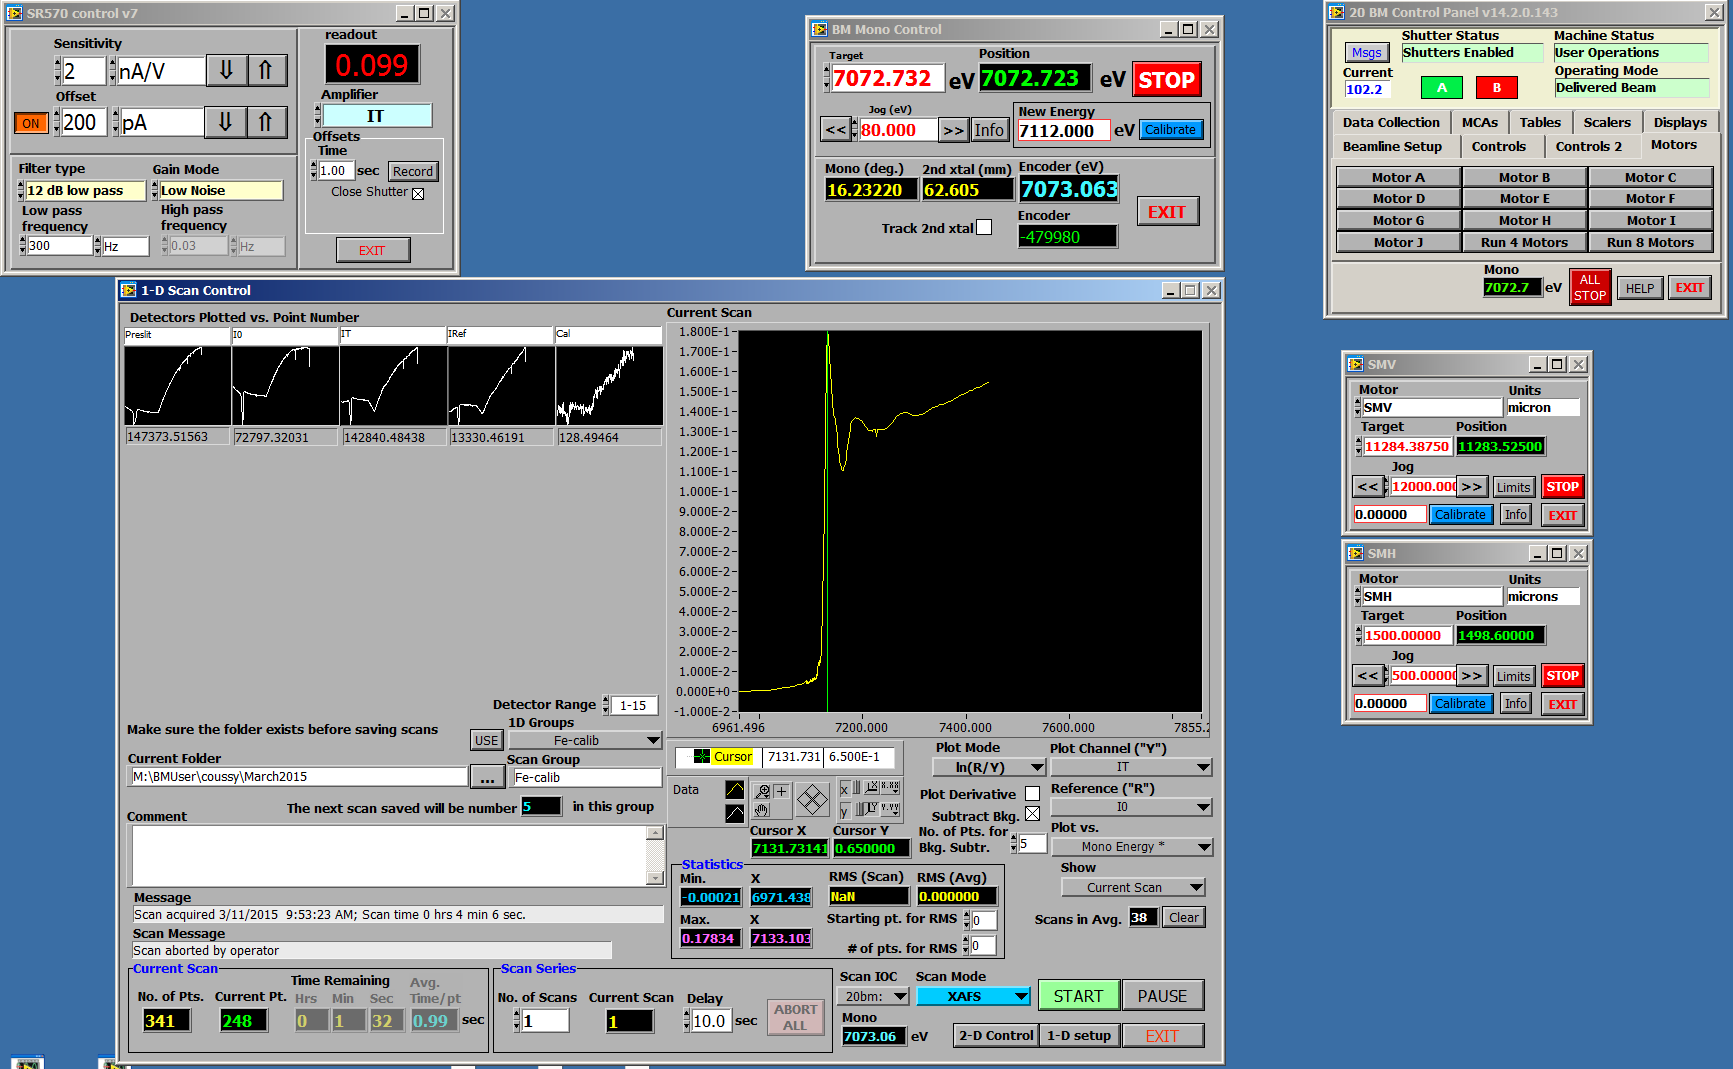
SPC "Control Panel" Data Acquisition Software
This was initially developed for PNC-CAT (sector 20) beamlines and has undergone continuous development and improvements for approximately 15 years and has also been placed in use for beamline 9-BM. The “Control Panel” is an integrated data acquisition environment for all of our supported experiments, such as XAFS, XES, 2D mapping with full MCA spectra, XEOL, NRIXS, and RIXS. It also provides data visualization tools for quick evaluation of data quality and preliminary data analysis at the beamlines. A windows installer is provided so users can use visualization at their home institutions.
Features:
- Based on common components of synApps (motor record, sscan record, areaDetector, DXP, etc.). TCP/IP and LabVIEW datasockets are also used.
- Designed to allow novice users to quickly operate the beamline and acquire data with minimal training.
- Extensive capabilities for GUI-based beamline automation, constructing a “sequence” of beamline actions, including moving motors, executing data acquisition, restoring scan configurations, switching between data acquisition modes, choosing data file “scan groups” for saving data, opening/closing shutters, controlling filters, and so on. Users often construct sequences consisting of hundreds of actions and automate data acquisition over periods of many hours. Users are notified by e-mail when a sequence is finished.
- Designed to hide the complexity of EPICS by automating potentially extensive setup changes, for example when loading new scan configurations, or switching between data acquisition modes such as XAFS acquisition mode and 2D quick (aka fly) scanning mode.
- Allows users to use meaningful labels rather than arbitrary PV names. Control Panel lists all common PVs that are used as sscan record “Detectors”, which are presented in categories with user-definable names. Detectors can be easily added and non-integrated PVs can be added “by hand” from medm.
- Control Panel also provides sscan record “Positioners”, which are also presented with user-definable names.New Positioners can be defined if needed for a particular experiment or scan. XAFS scans are configured without the user needing to know the Positioners used in the sscan configuration (simply edge energy, energy range of scan regions, etc.).
- Choosing detector triggering during scans is a point-and-click option. Control Panel accommodates the commonly used detectors, such as our SSDs, the Detector Pool SSDs, Pilatus, etc. Users select which detector or detectors are to be used from a list, and then choose whether or not to trigger them during scans by selecting them from the GUI.
- Capability for saving and recalling scan configurations, sets of sscan record Detectors, and sequences. New scan configurations and sequences can be created, edited and saved while a scan or sequence is executing.
- Modern GUI features, such as pop-up dialogs, guide users’ actions by alerting them of error conditions, and confirming or preventing them from performing questionable actions.
Contact: Dale L. Brewe
|
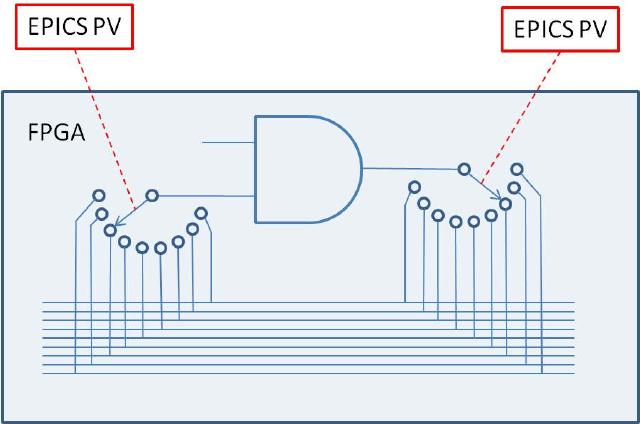
EPICS softGlue
The synApps softGlue module enables EPICS users and application developers to construct small, simple, digital electronic circuits, and to connect those circuits to field wiring, all by writing to EPICS PV's. Because the circuits and field connections are defined entirely by EPICS PV's, they can be autosaved and restored, saved as text files (for example, as BURT snapshot files), emailed from one user to another, etc. softGlue also provides safe (throttled) user control over how hardware interrupts are generated by field I/O signals, and how they are dispatched to cause EPICS processing.
The name softGlue is intended to suggest glue electronics implemented by software, where glue electronics means those little bits of digital circuitry needed to connect two or more larger pieces of digital electronics into a working whole.
softGlue does this by loading an IndustryPack FPGA-based digital I/O module with a predefined collection of circuit elements (logic gates, counters, flip-flops, etc.), whose inputs and outputs are connected to switches controlled by EPICS PV's. softGlue provides a user interface for controlling those switches, allowing inputs and outputs to be marked with user-specified names, and connecting or driving inputs and outputs according to those names.
Links: documentation and examples.
Author: Tim Mooney
|
|
spec2nexus
Python tools and support libraries: Converts SPEC data files and scans into NeXus HDF5 files. Consists of the following tools and libraries:
- spec2nexus : command-line tool: Convert SPEC data files to NeXus HDF5
- h5toText : command-line tool: Print the tree structure of an HDF5 file
- extractSpecScan : command-line tool: Save columns from SPEC data file scan(s) to TSV files
- spec2nexus.spec : library: python binding to read SPEC data files
- spec2nexus.eznx : library: (Easy NeXus) supports writing NeXus HDF5 files using h5py
Link: documentation.
Author: Pete R. Jemian
|
|
specdomain
Python support libraries: Provides an extension for Sphinx to document SPEC macro source code files. SPEC is control software for X-Ray Diffraction and Data Acquisition of scientific instruments commonly used at the APS.
This code extracts useful documentation from SPEC macro source code files and builds a set of web pages with indexing and search tools.
Link: documentation.
Author: Pete R. Jemian
|
|