- GIXSGUI is Matlab-based software for visualization and reduction of Grazing Incidence X-ray Scattering data, written by Zhang Jiang.
- Reference: "GIXSGUI: a MATLAB toolbox for grazing-incidence X-ray scattering data visualization and reduction, and indexing of buried three-dimensional periodic nanostructured films," Z. Jiang, J. Appl. Cryst. (2015). 48, pp 917-926 [doi:10.1107/S1600576715004434 ]
- Documentation
- doc.pdf help documentation provides an overview of the software (included in both the full and lite zip files below)
- linefit_manual.pdf manul for GIXSGUI's curve fitting capabilities (included in both the full and lite zip files below)
- Installation
- Download zipfile (full or lite version) and extract the GIXSGUI distribution.
- Start Matlab. On the Home tab, click "Set Path" > "Add with Subfolders..." and select the folder that contains the GIXSGUI distribution. Click "Save" and "Close".
- Enter "gixsgui" into the Matlab command line to start GIXSGUI.
- Improper path is the most frequent casue of trouble with GIXSGUI. Always check the path setting first when troubleshooting!
- Version 1.7.3 posted 2019.08.23 on github.
- Version history
- Version 1.7.1 posted 2017.08.11: includes complete license information
- Version 1.7.0 posted 2017.01.23: updated gixsdiffpos.
- Version 1.7.0, posted 2016.10.30: first version to include linefit.m, curve-fitting package.
- Version 1.6.4, posted 2016.05.08 (support for EDF data, angle calibration, scaling (vertical shift) in linecut overlay)
- Version 1.6.2, posted 2015.03.13 (supports Matlab release R2014b)
- Version 1.6.1, posted 2015.01.05 (updated Lorentz correction)
- Version: 1.6, posted 2014.10.31
- Version 1.5.2, posted 2014.07.02:
- Previous version: GIXSGUI_2013015
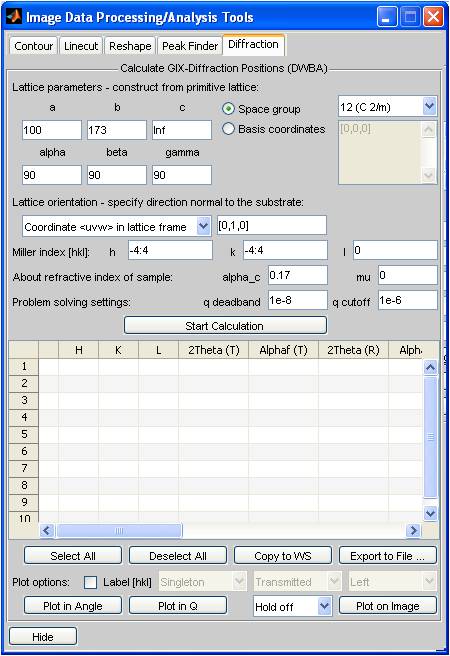
- Version 1.4.0, first version including diffraction tab for computing crystalline reflections
- Consider this a beta-test: documentation does not yet describe the new features
- To enable new features, add the subdirectory "analysis" to the path in Matlab
- When the path is set properly, the Data Processing window will have a Diffraction tab that looks like this:
- Version 1.3.5, last version without diffraction tab
- Version 1.3.4
- Version released 2011.12.14
- New flatfield data for all data collected at 8-ID-E since 2011.12.01
- New added capability in defining masks
- Version released 2011.11.30
Email questions or comments to: [email protected].
|