
|
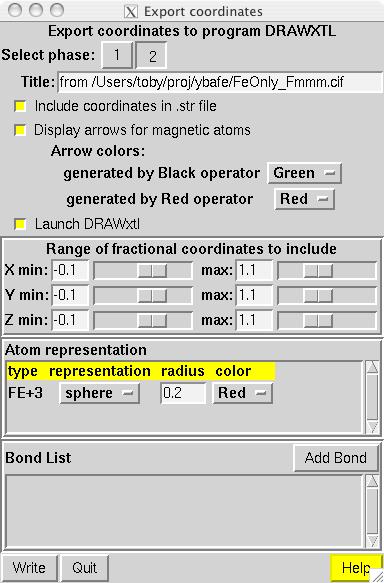
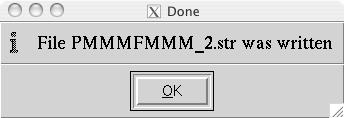
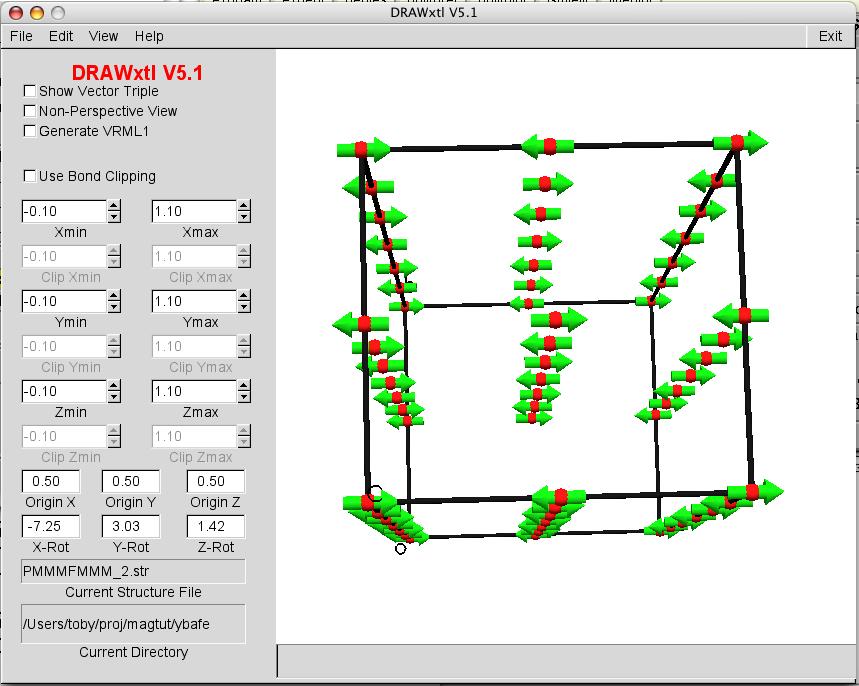
To visualize the contents of magnetic unit cell, the DRAWxtl program can be accessed through a menu in EXPGUI. In this following example, it is assumed the experiment PMMMFMMM has been selected for use in EXPGUI. To initiate the DRAWxtl export menu, select the EXPGUI Import/Export menu, then select the Coord Export submenu and from that menu select the "export to DRAWxtl (.str) file" option. This raises a menu with information pertaining to the first phase (screen image). Note that the "Launch DRAWxtl" option is greyed-out when the DRAWxtl program cannot be located on your computer (the location is determined by reading a file created by DRAWxtl named .drawxtlrc which is located in your home directory in Unix/Mac OS X computers or in your user directory in Windows.) Likewise, the "Display arrows for magnetic atoms" option becomes available only when a magnetic phase is selected. The "Include coordinates in .str file" offers an option to have the input file for DRAWxtl (the .str file) either include coordinates copied from the current refinement results or reference the .EXP file. If the latter option is selected, the .str must be located in the same directory as the GSAS .EXP file. Selecting the second phase using the button at the top of the window causes the menu to change (screen image). Now the "Display arrows for magnetic atoms" option becomes available now as well as additional options to determine arrow colors.Pressing the "Write" button at the bottom of the window causes an input file to be written. A window shows the name of the file that has been created (screen image). Note that the suffix "_2" is added to the GSAS experiment name to indicate phase 2. If the "Launch DRAWxtl" option is available and selected, then the DRAWxtl program is launched, which can display the directions of the magnetic spins (screen image). Note that spin directions are generated using the (list spins option in program GEOMETRY so results prior from GSAS prior to August of 2005 may be incorrect. By default, DRAWxtl displays output on the screen using OpenGL graphics, but graphical output can also be obtained using the POVRAY program to produce high quality ray-traced diagrams. Output can also be supplied as VRML version 1 or version 2 files. |