Chapter 8 Plots
4. Strip Charts
Strip chart plots simulate an eight-pen strip chart, i.e., they can have up to eight "pens" connected to eight different channels. You specify the channels that the chart will plot in the 'pen channel' properties. The channels are always plotted on the y axis. They are plotted against the time interval specified by the 'delay between samples' and 'delay units' properties. The time interval is plotted on the x axis.
DM updates the plots and draws the changes at each time interval specified in the 'delay between samples' and 'delay units' properties.' As changes occur, they are plotted, and as data goes past the end of the strip chart, the strip chart is shifted to the left. DM does not update the strip chart or shift the strip chart to the left if no changes occur.
To force the effect of an actual chart, i.e., so that the chart is updated constantly and the strip chart shifts to the left continuously even when the value does not change, specify at least one channel in the 'pen channel' properties that changes at the rate of the time interval specified in the 'delay between samples' and 'delay units' properties. All the other channels that do not change at that rate, should be preceded by an "F" as asynchronous channels (explained earlier in the chapter). If you configure the strip chart this way, all the pen channels will be updated at the specified time interval, even if no changes occur in them.
The time interval is determined by the 'delay between samples' and 'delay units' properties. The 'delay units' property contains a menu from which you can choose several time periods: day, hour, minute, second, milli second, and micro second. In the 'delay between samples' property you enter in a number. Together these properties specify a time interval, four seconds, for instance. DM will continually update the strip chart at each time interval, every four seconds, for instance. The minimum value you can have in the 'delay between samples' property is one.
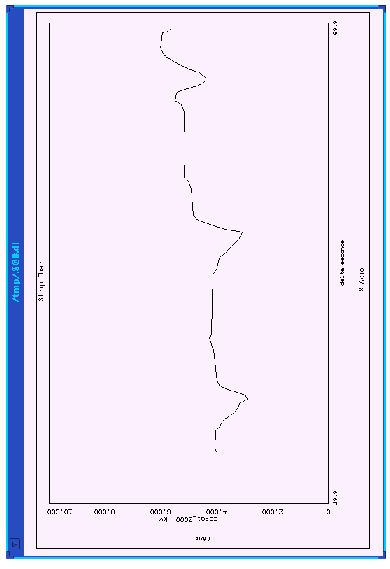
Figure 8-4 shows a strip chart with one pen channel plotted in intervals of one second.
Strip Chart with One Pen Channel (plotted in seconds).
EDD/DM User's Manual, 2.4 - 27 MARCH 1997 [Next] [Previous] [Up] [Top] [Contents] [Index]