Chapter 6 Monitors
3. Bars
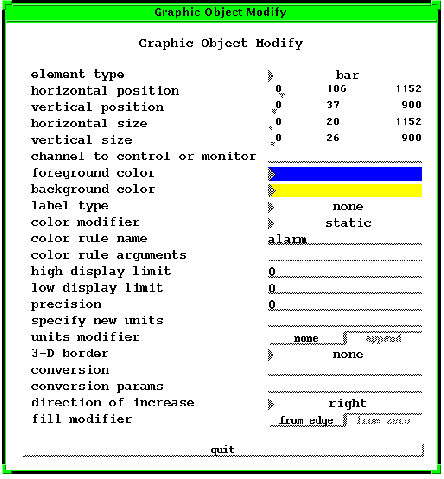
Bars represent the value of the channel they monitor by a bar graph that increases or decreases in length according to the increase and decrease of the channel's value. Like indicators, bars have high display and low display limits modifiable by the 'high and low display limit' properties in their property sheets. Like indicators, you can specify the amount of information a bar will display at run-time with the 'label type' property. The 'direction of increase' property determines whether the bar is situated horizontally or vertically and towards which direction the bar increases and decreases. Bars also have a 'fill modifier' property that determines where the bar "starts"--from zero or from whatever edge is determined by the 'direction of increase'. Figure 6-8 shows the property sheet of a bar.
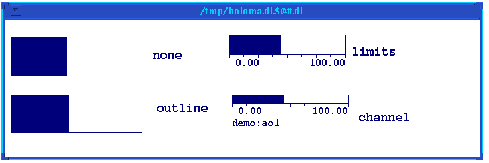
The 'label type' property determines the amount of information the bar displays at run-time. When the setting for this property is none, only the bar graph itself will appear at run-time. When the setting is outline, the bar and the outline of the gauge will appear. When limits, the bar, the outline, and the high and low display limits appear, the displayed limits appearing at either end of the gauge. And when channel, the bar, the outline, the display limits, and the name of the channel that the indicator is monitoring appear. Figure 6-9 shows four bars at each label type setting.
Bars have display limits that determine the range of values the bar operates in. The 'high and low display limit' properties in the bar's property sheet determine what these values are. You can set the 'high or low display limits' by entering in a value for either property. The bar will then operate within the range set by these limits, and these values will be displayed when the label type setting is either limits or channel. When left at 0, the display limits are retrieved from the database. An important thing to note about setting the display limits this way is that when you enter in the text for one display limit, the other ceases to retrieve its value from the database, even if it is zero.
Unlike indicators, bars cannot display values outside their display limits. When the value of the channel exceeds one of the display limits, the bar simply shows an arrow pointing towards the exceeded display limit indicating that the value is out of range.
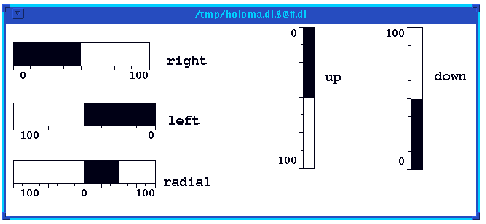
The 'direction of increase' property determines the direction towards which the bar will increase. It also determines how the bar is situated, horizontally or vertically. There are five settings for this property:
- 1. right
- 2. left
- 3. up
- 4. down
- 5. radial
The up and down settings situate the bar vertically. Up will situate the bar so that it increases upwards, from bottom to top; thus, the low display limit will be on the bottom edge of the object, and the high display limit on the top edge of the object. The down setting will situate the bar so that it increases downwards, from top to bottom; thus, the low display limit will be on the top edge of the object, and the high display limit on the bottom edge.
The radial setting does something slightly different from the other settings in the 'direction of increase' property. It makes the low display limit and the high display limit to be the same distance from zero--it makes the low display limit a negative number so that there is an equal amount of space between the zero and both display limits. For instance, if the low display limit is 0 and the high display limit, 100, the radial setting will make the operating range from -100 to 100 with the direction of increase starting at 0 and increasing from there towards 100 or -100 according to the value. It does not actually change either display limit in the property sheet. The radial setting always situates the bar horizontally and starts the increase of the bar at zero. Thus, it makes the next property, the 'fill modifier' property, insignificant.
Figure 6-10 shows the run-time appearance of bars for all the settings of the 'direction of increase' property.
Direction of Increase for Bars.
The next property that affects a bar's run-time appearance and behavior is the 'fill modifier' property, the last property on a bar's property sheet. It is only useful when the low display limit is a negative number. When the low display limit is a negative number, you can set the fill modifier either to from edge or from zero. When set to from edge, the bar starts its increase from the low display limit, the edge of the object. When set from zero, instead of starting from the low display limit, the bar starts its increase (or decrease) from zero. The settings from this property have no effect when the direction of increase setting is radial, because the radial setting always starts the bars increase (or decrease) from zero.
EDD/DM User's Manual, 2.4 - 27 MARCH 1997 [Next] [Previous] [Up] [Top] [Contents] [Index]

