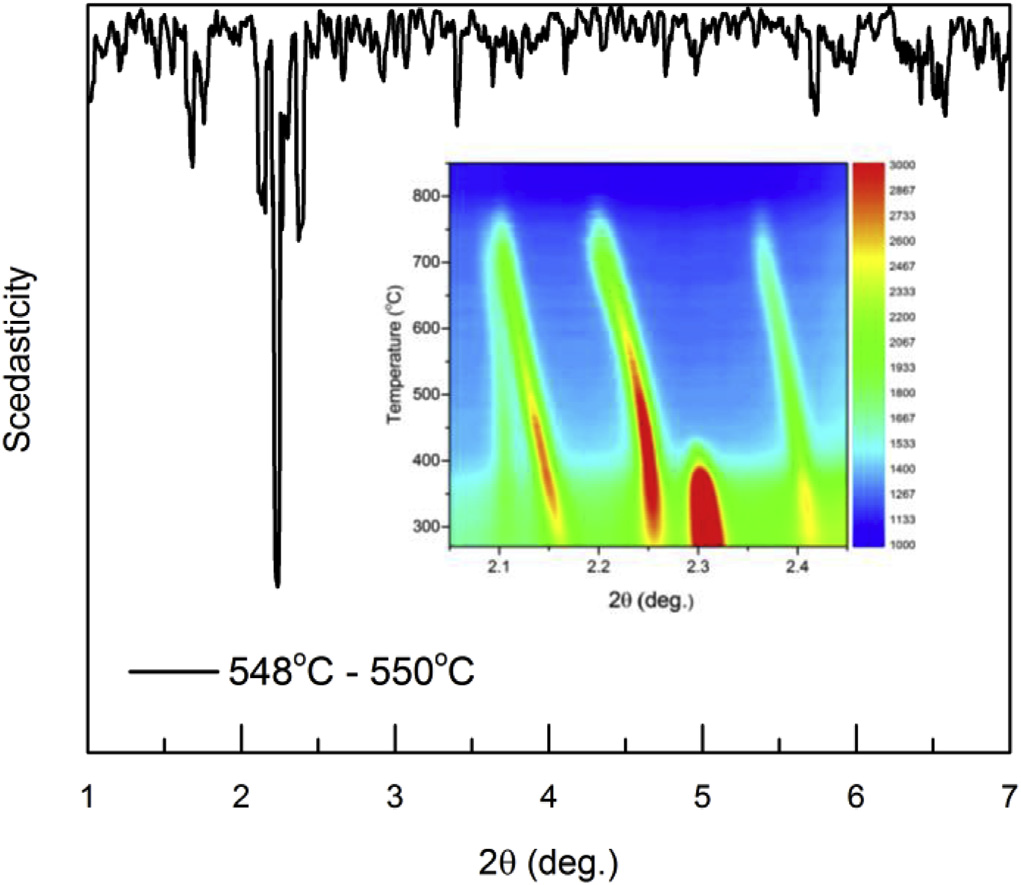
A package of two computation methods ‘Correlation’ and ‘Scedasticity’ extracts critical information on sample response from series of large ranked data sets. The methods used are based on correlation functions and statistical scedasticity formalism, and thus they are generally applicable to all types of spectra and diffractograms that evolve as a function of any arbitrary parameter. This allows large datasets that are accumulated via high throughput experiments to be analyzed straightforwardly, addressing a major challenge in parametric studies. The methods can be readily applied for on-the-fly data analysis during various in situ or operando experiments, providing immediate feedback on regions of interest for greater experimental consideration. Likewise, they may be used for mining significance during post-experiment data analysis, where considerable volumes of data prevents point-by-point inspection. 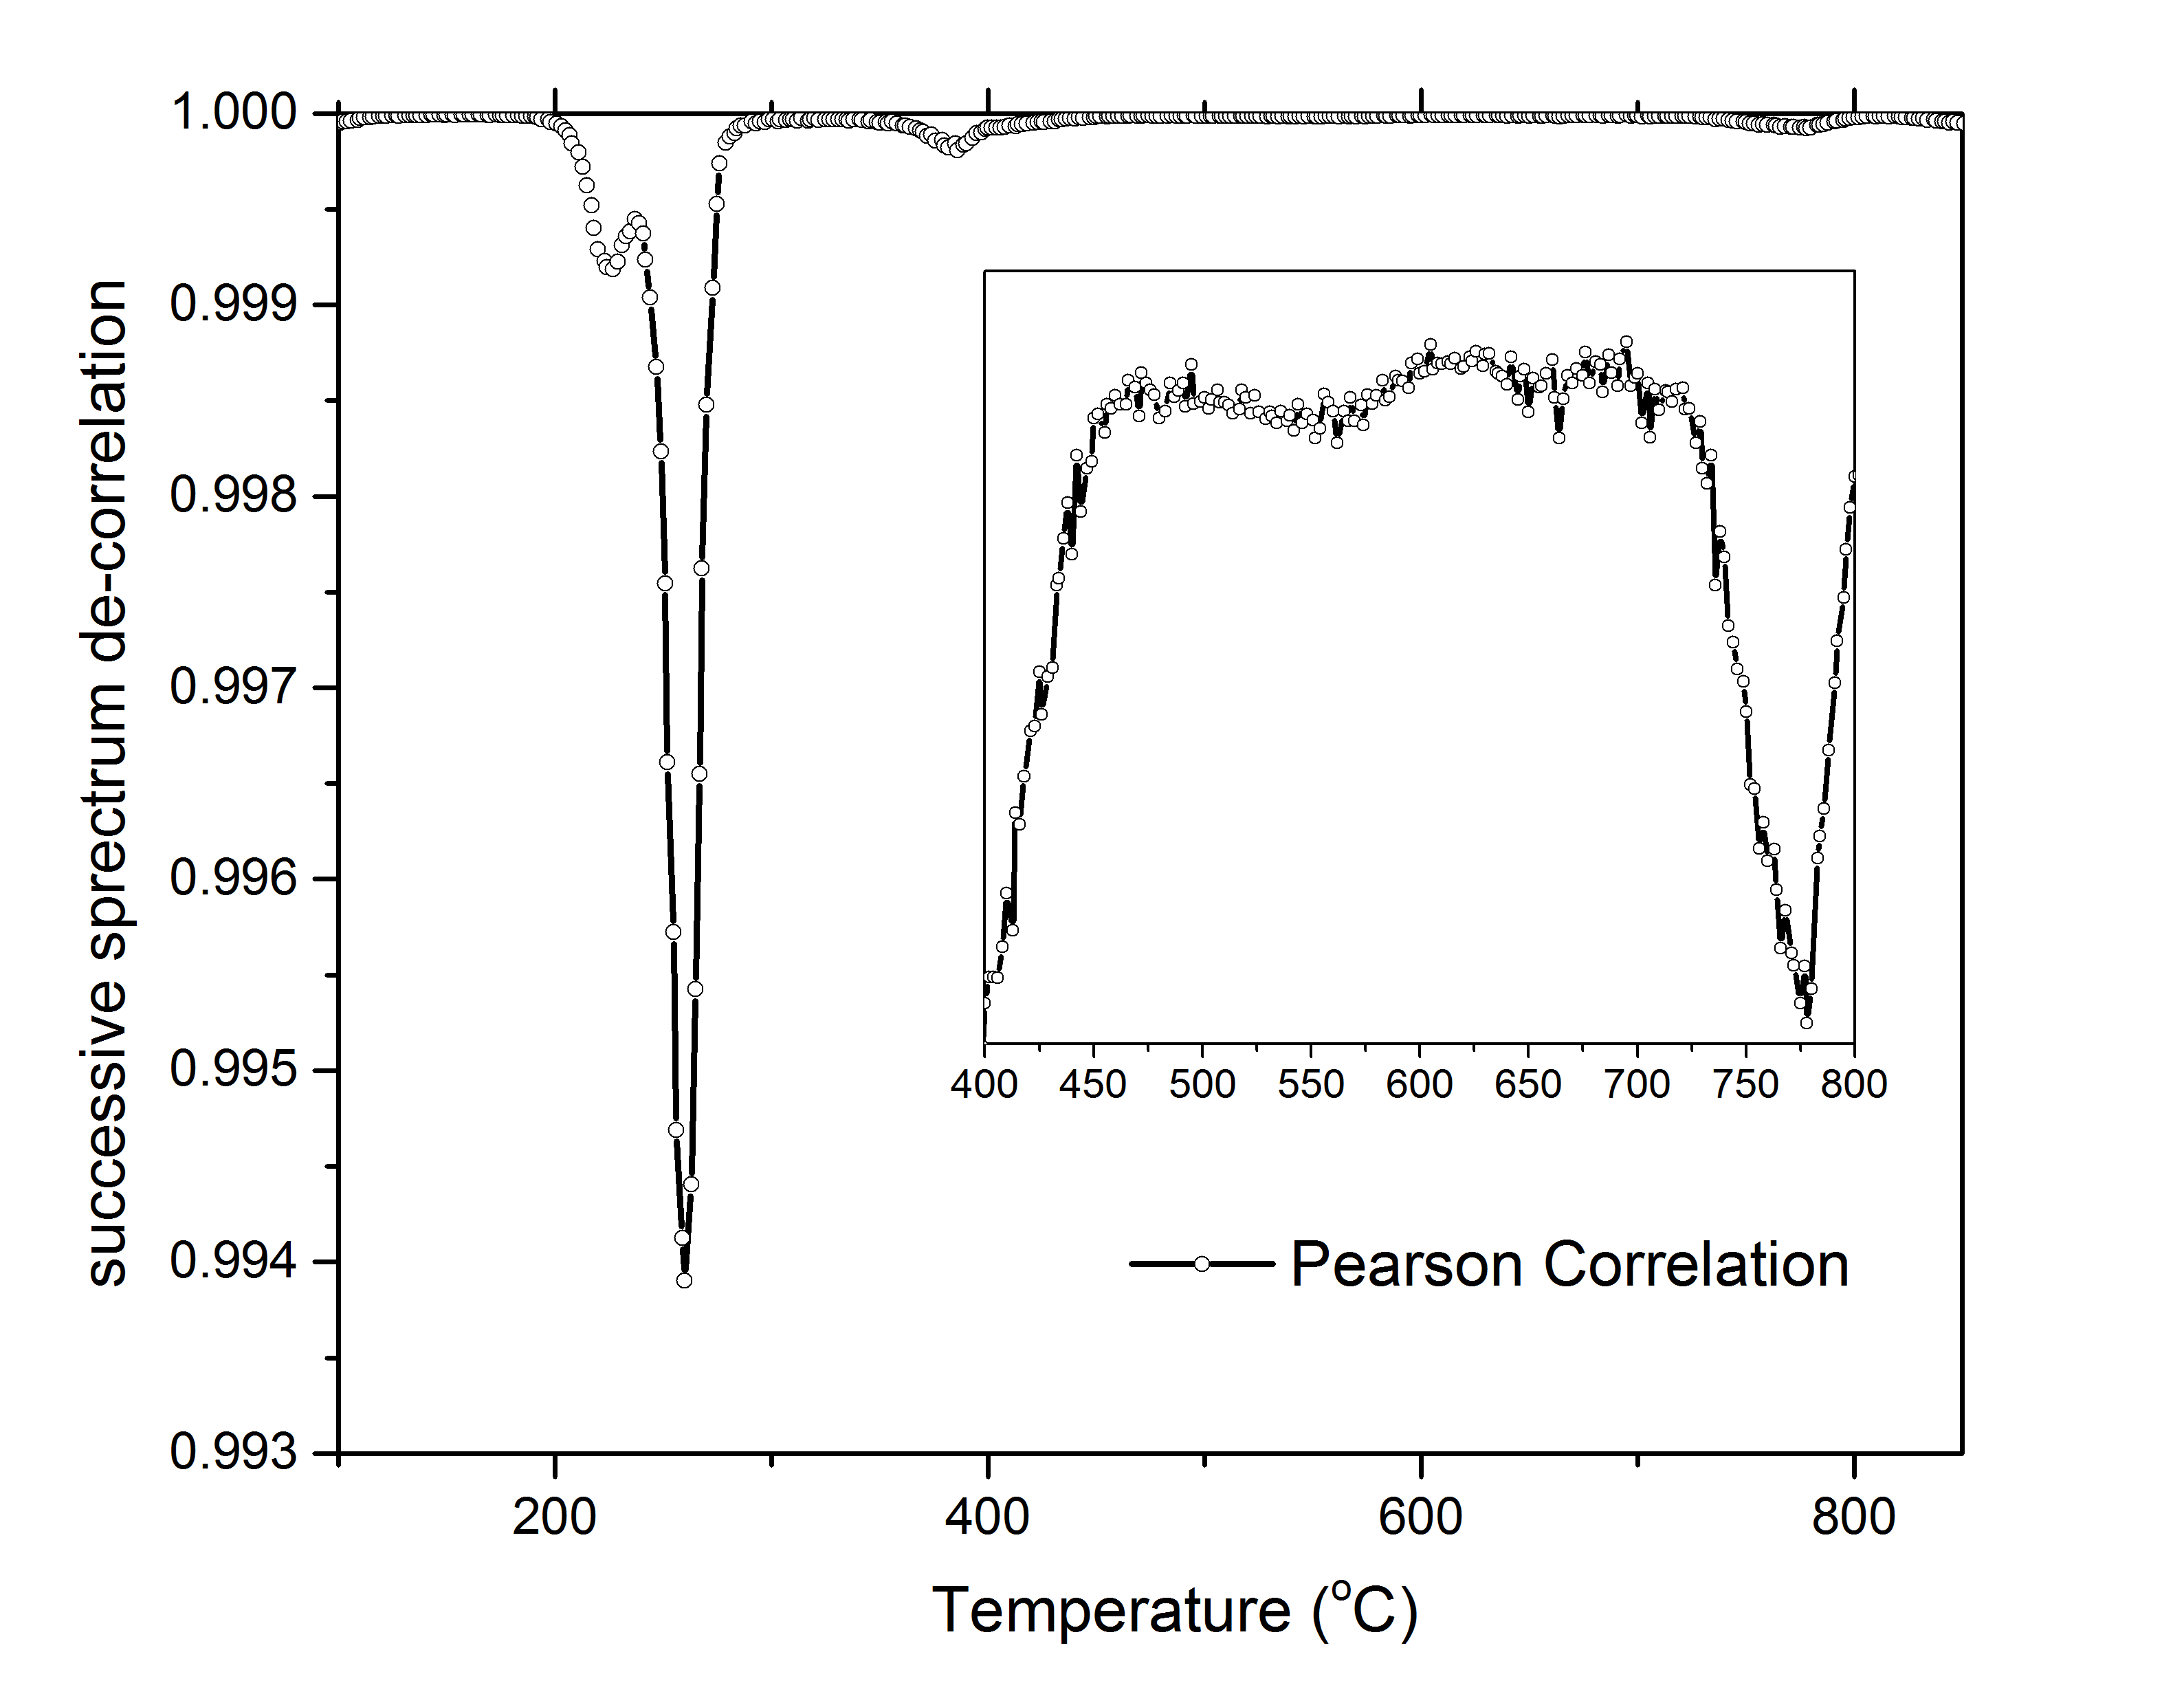
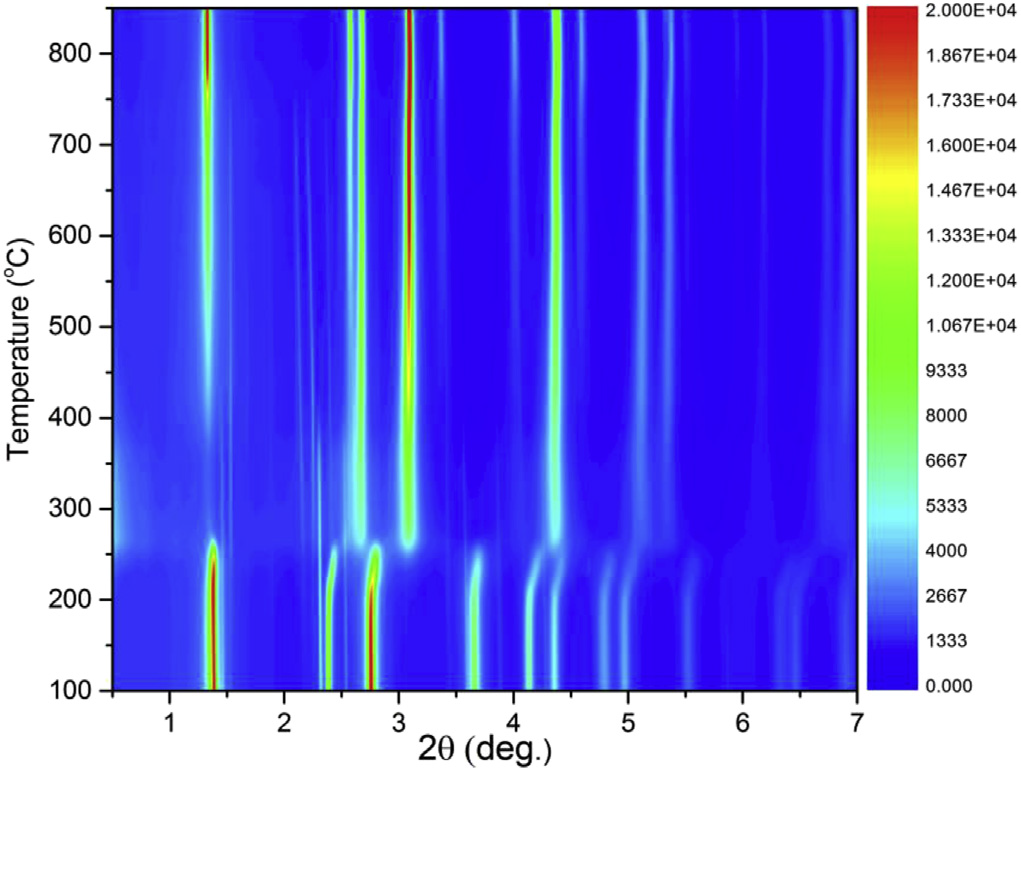
Furthermore, a two-dimensional (2D) reactivity pattern calculated as the scedasticity along all measured reciprocal space of all successive diffraction pattern pairs unveils clearly the structural evolution path and the active areas of interest during the synthesis (see figures below). 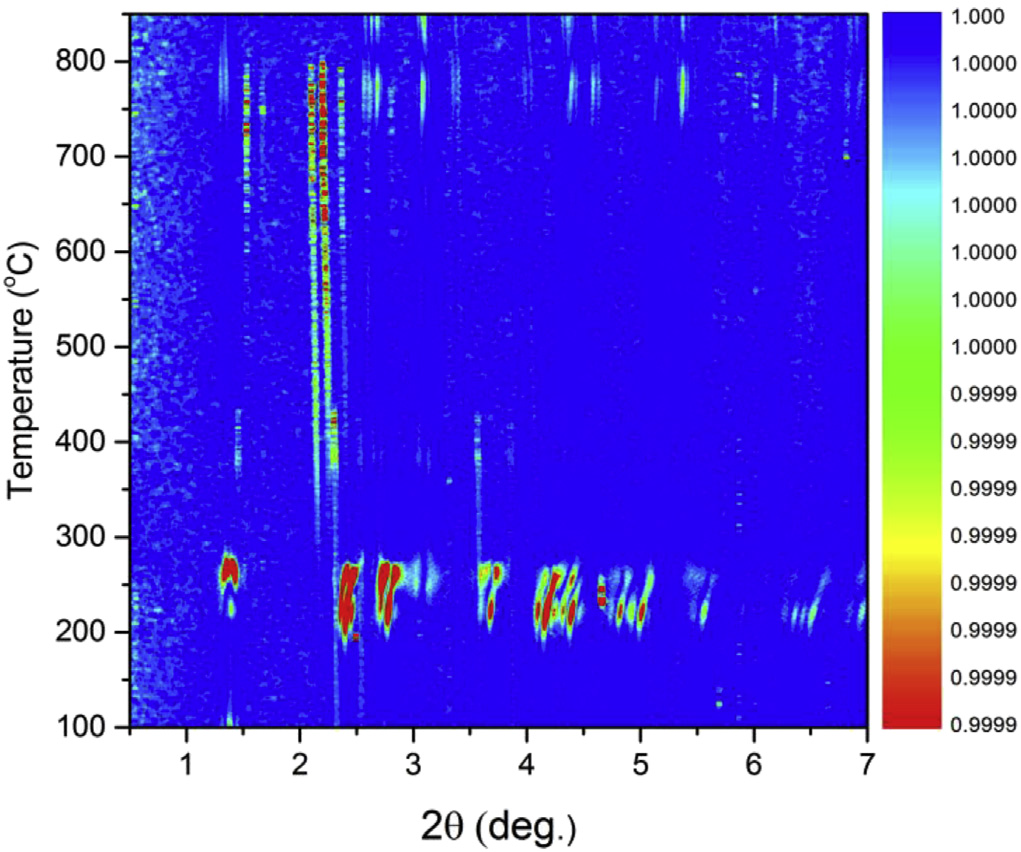
|
| Distribution & Impact |
|
| Funding Source |
|
Development was funded by U.S. Department of Energy, Vehicle Technologies Office as well as operational funding from the APS, contract DE-AC02-06CH11357 |
| Please cite |
|
Please cite: Bachir Aoun, Cun Yu, Longlong Fan, Zonghai Chen, Khalil Amine, Yang Ren, “A generalized method for high throughput in-situ experiment data analysis: An example of battery materials exploration”; Journal of Power Sources 279 (2015) 246-251 |
| Future Work |
|
Develop the math and generalize the code to look for correlation directly from 2D and 3D images. |