Data analysis software is fundamental to scientific discovery at the APS. The impressive variety of world-leading techniques performed at the APS coupled with the facility’s diverse user base naturally leads to a demand for a variety of different software tools. Despite this variety, some analysis techniques are of common interest to many APS beamlines, either as a primary form of analysis, or through use as a data processing step performed as a part of a larger analysis workflow.
An example of such a common data analysis technique is found in reciprocal space mapping (RSM) tools. RSM tools are used to transform data from diffractometer-space (images collected at a set of angles) into reciprocal-space (scattered intensities at q ⃗) or in terms of the related Miller Indices (h, k, l). The output from this mapping often forms the basis of further data analysis. For example, they are used as a part of general-purpose scattering and diffraction (including micro-diffraction) beamlines. Additionally, these tools are used for techniques that study dynamics, such as time-dependent diffraction, to provide reciprocal-space input to wide-angle x-ray photon correlation spectroscopy (WA-XPCS) reduction software, or to assist in the discovery of spectroscopic features associated with particular lattice sites, which can then be studied further. As with many other techniques at the APS, the development and application of higher frame rate detectors enables novel science in a wide range of diffraction-based areas. A consequence of these detector advancements is the creation of greater amounts of image data that must be processed, making parallel computation necessary.
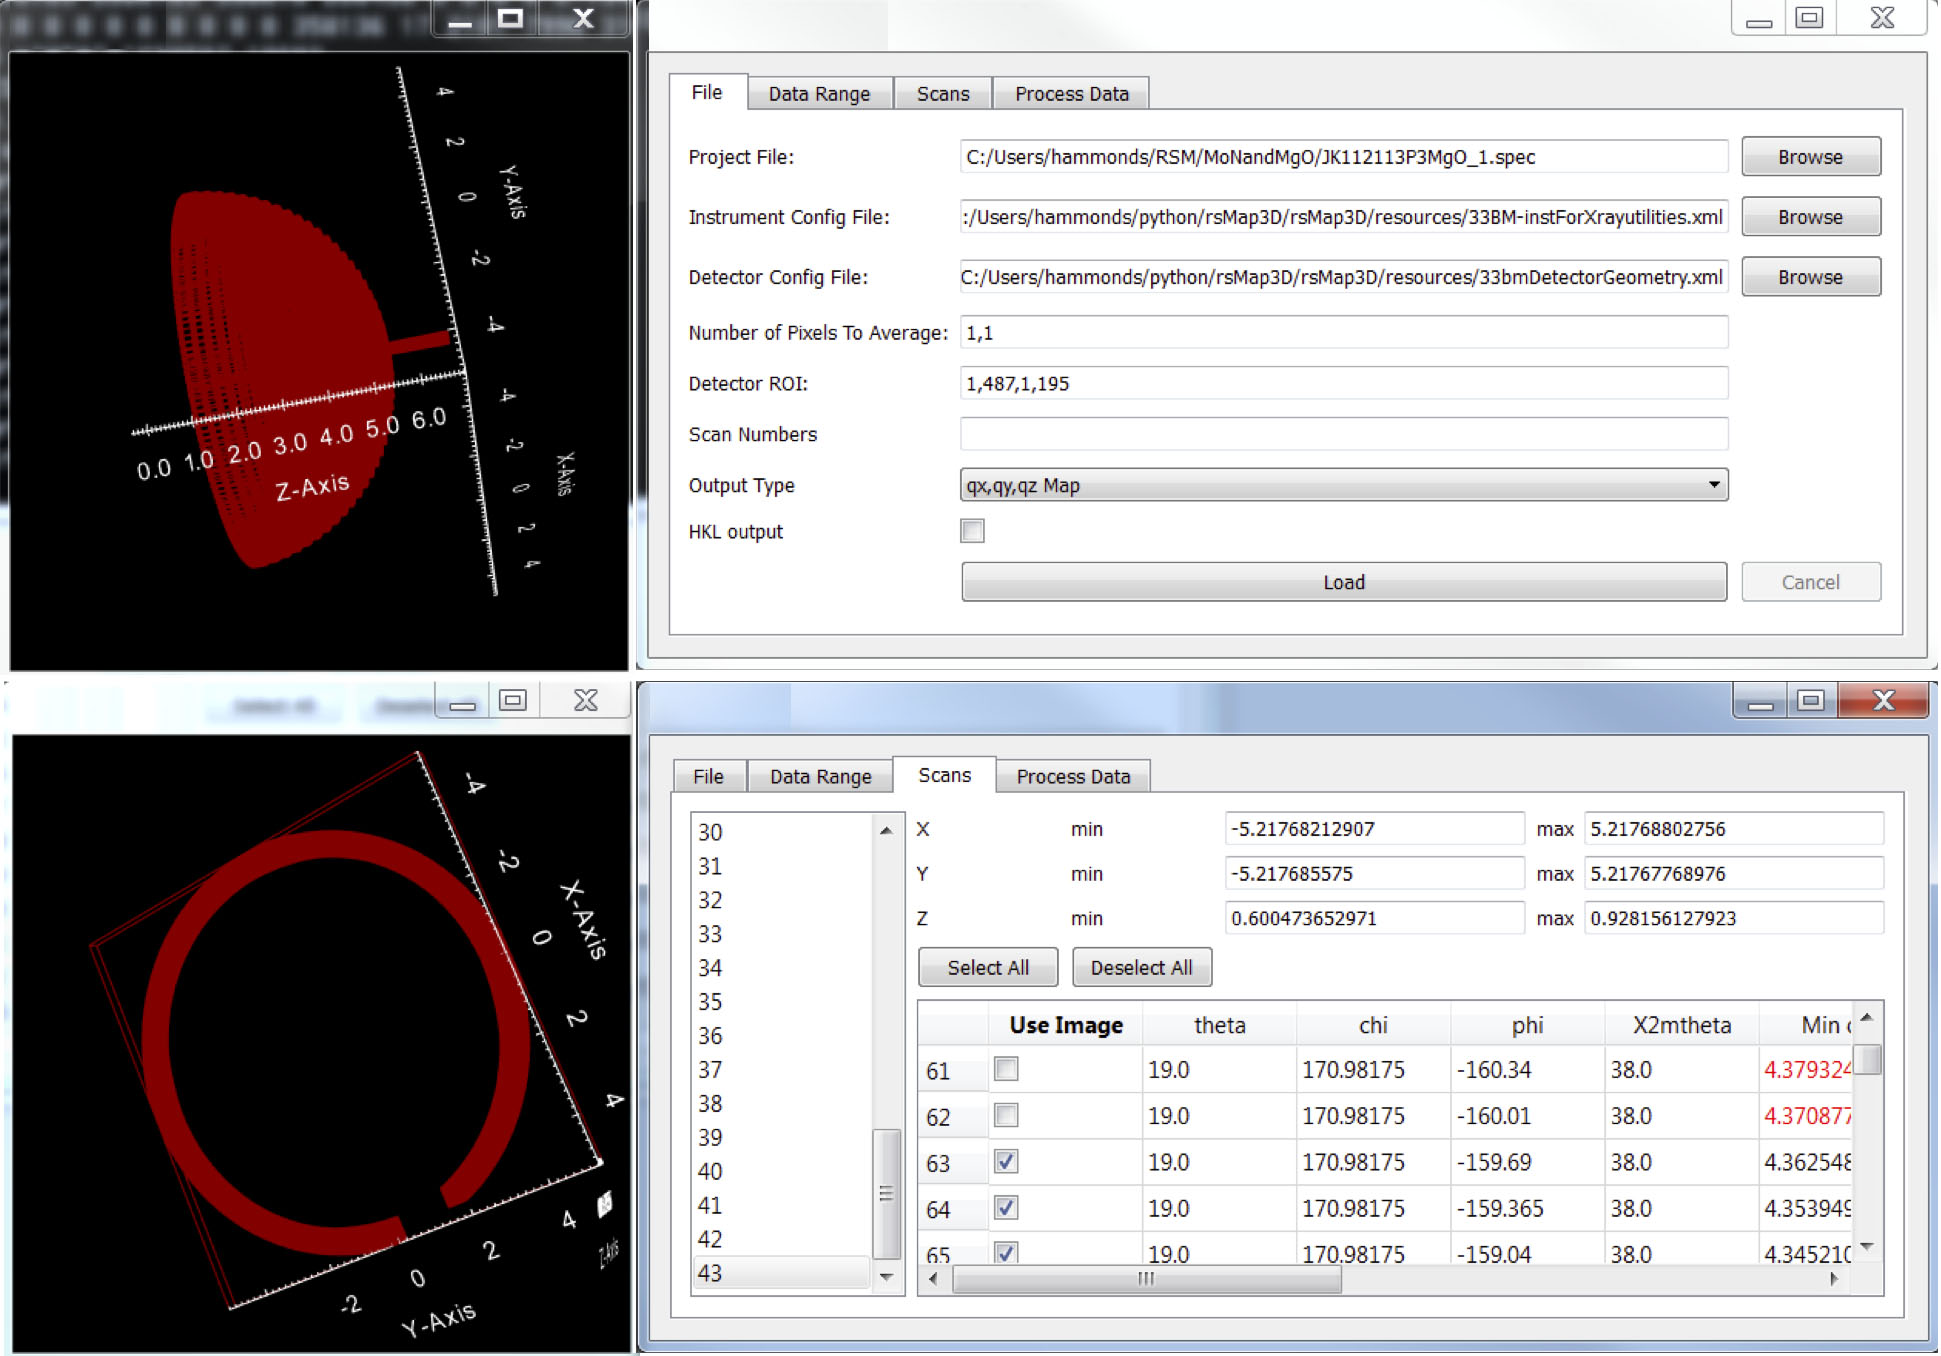
In this area, the APS continues to develop the RSMap3D software package, a general-purpose tool for reciprocal-space mapping. The tool allows users to examine a volume of data and select portions on which to apply transformations that convert detector pixel locations from diffractometer geometry to reciprocal-space units, and then map pixel data on to a 3D reciprocal-space grid. RSMap3D can map data acquired using four- and six-circle diffractometers, and with scans taken over angles or energy. The application presents a graphical interface for selecting the relevant parts of data to process via a 3D representation of the acquired data volume (Fig. 1, click image to enlarge). Scan angle or energy data is usually read from data files generated by spec, while image data is often read from TIFF or HDF5 files. The core mapping routines utilize the OpenMP programming API to parallelize operations across multiple cores on a workstation for increased performance. Data too big to fit entirely into memory at one time is processed in smaller chunks and reassembled to form the final output volume, allowing users to process arbitrarily large input datasets.
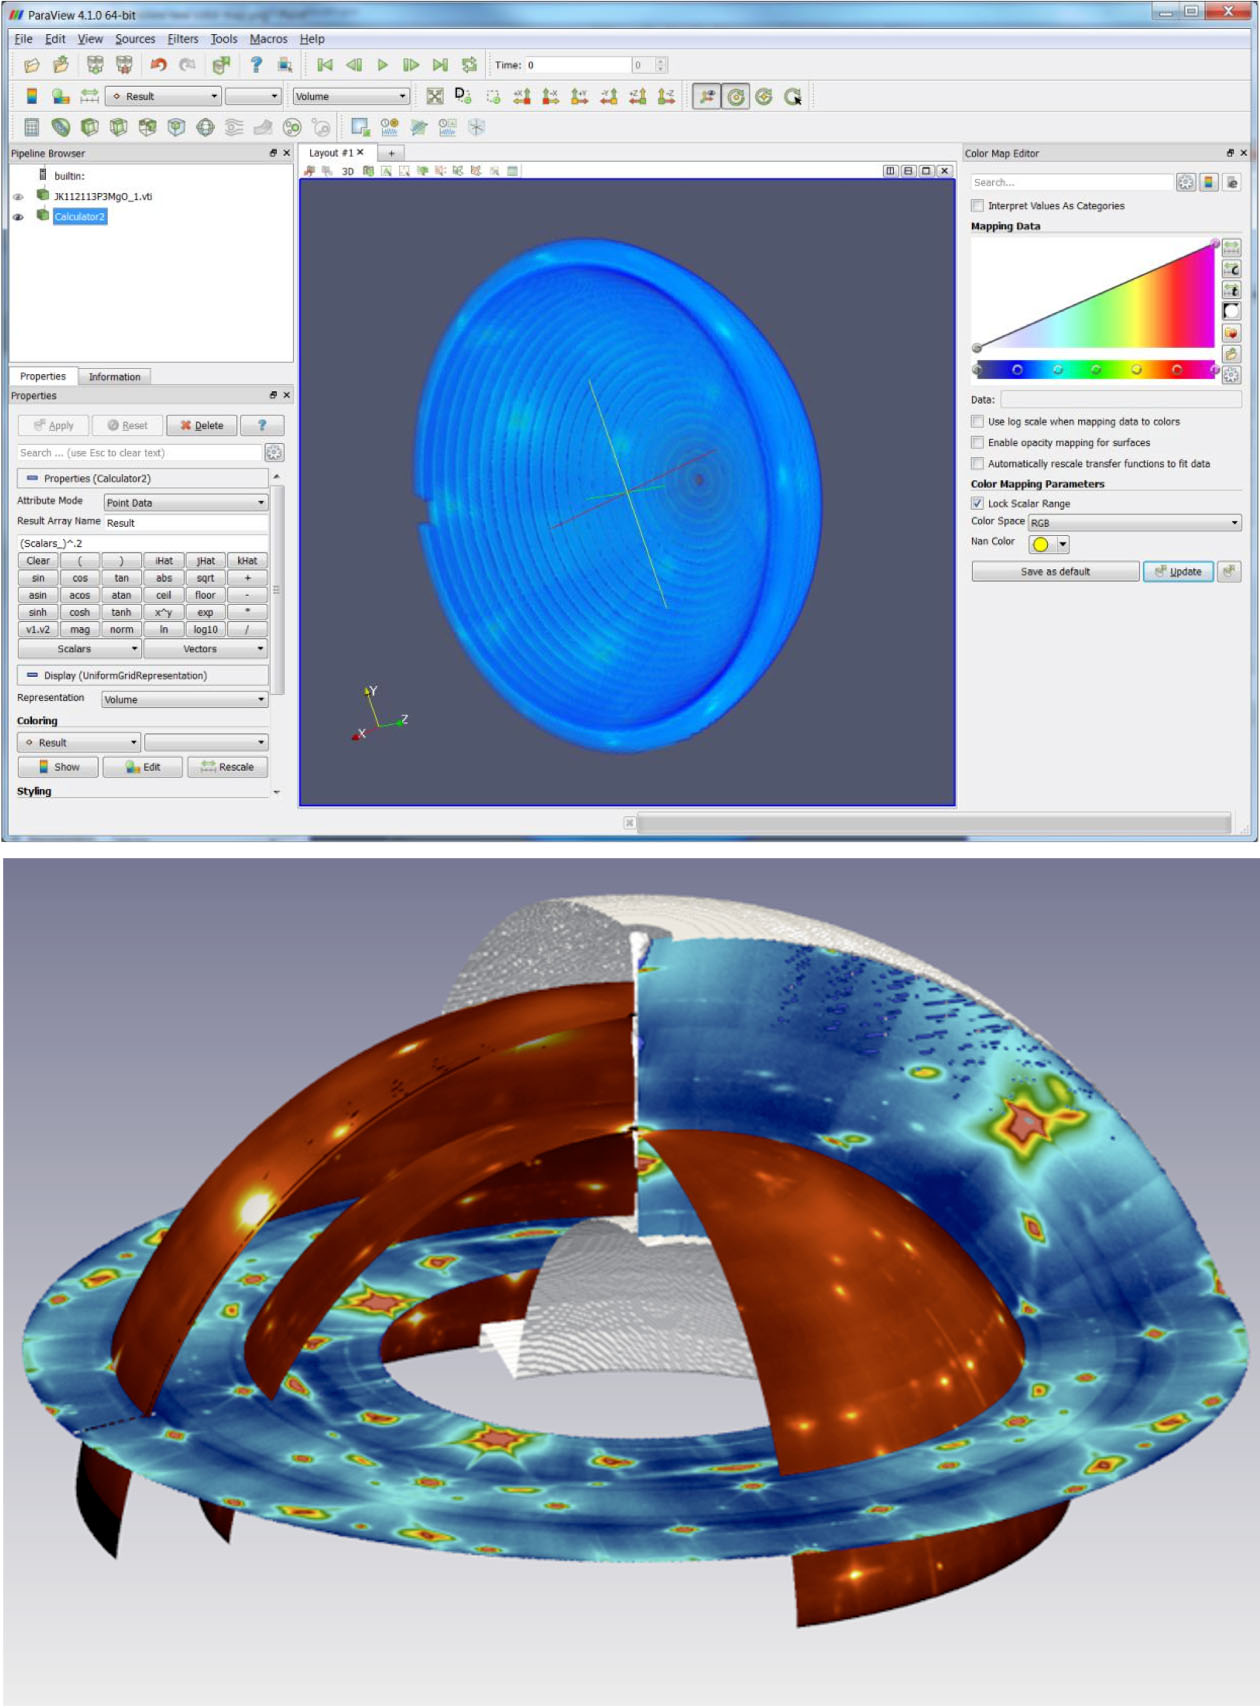
Once data is processed it may be used as input to further analysis workflows. Additionally, visualization is often an important part of the data analysis process. Data generated by RSMap3D is easily read by ParaView, an open source, high-performance tool for 3D data visualization and manipulation. ParaView allows the user to easily produce 3D contour plots, and make slices through the data using plane cuts or cuts on the surface of a defined sphere, for constant |q ⃗| cuts, for example. Using RSMap3D in combination with sophisticated visualization tools enables APS staff and users to study large diffraction data quickly and effectively (Fig. 2).
RSMap3D is written in Python and relies heavily on the xrayutilities, spec2nexus, and VTK libraries. It is easily installed using the pip package management system, and runs on the Linux, OS X, and Windows platforms. RSMap3D is currently in regular use for scattering and diffraction experiments at the 33-BM and 33-ID beamlines, for micro-diffraction analysis at 34-ID, and for time-resolved diffraction work at 7-ID. Development is underway for WA-XPCS analysis at 8-ID and for data exploration with inelastic x-ray measurements at 30-ID.
Acknowledgements: The RSMap3D software package was developed, and is supported and maintained by the XSD Scientific Software Engineering & Data Management group (XSD-SDM) in collaboration with Jonathan Tischler (XSD-SSM) with funding from DE-AC02-06CH11357.
Argonne National Laboratory is supported by the Office of Science of the U.S. Department of Energy. The Office of Science is the single largest supporter of basic research in the physical sciences in the United States, and is working to address some of the most pressing challenges of our time. For more information, please visit science.energy.gov.
By John Hammonds (XSD, jphammonds@anl.gov), Jonathan Tischler (XSD, tischler@aps.anl.gov), Christian Schleputz (christian.schlepuetz@psi.ch), and Nicholas Schwarz (XSD, nschwarz@aps.anl.gov)