Experimental Physics and
Industrial Control System
| 1994 1995 1996 1997 1998 1999 2000 2001 2002 2003 2004 2005 2006 2007 2008 2009 2010 2011 2012 2013 2014 2015 2016 <2017> 2018 2019 2020 2021 2022 2023 2024 | Index | 1994 1995 1996 1997 1998 1999 2000 2001 2002 2003 2004 2005 2006 2007 2008 2009 2010 2011 2012 2013 2014 2015 2016 <2017> 2018 2019 2020 2021 2022 2023 2024 |
| <== Date ==> | <== Thread ==> |
|---|
| Subject: | Question about epics/Labview and Ca Lab -- how to put time to my PV from signal waveform chart in labview. |
| From: | lzf neu <[email protected]> |
| To: | "[email protected]" <[email protected]>, "[email protected]" <[email protected]> |
| Date: | Tue, 26 Sep 2017 12:54:52 +0000 |
|
hi,
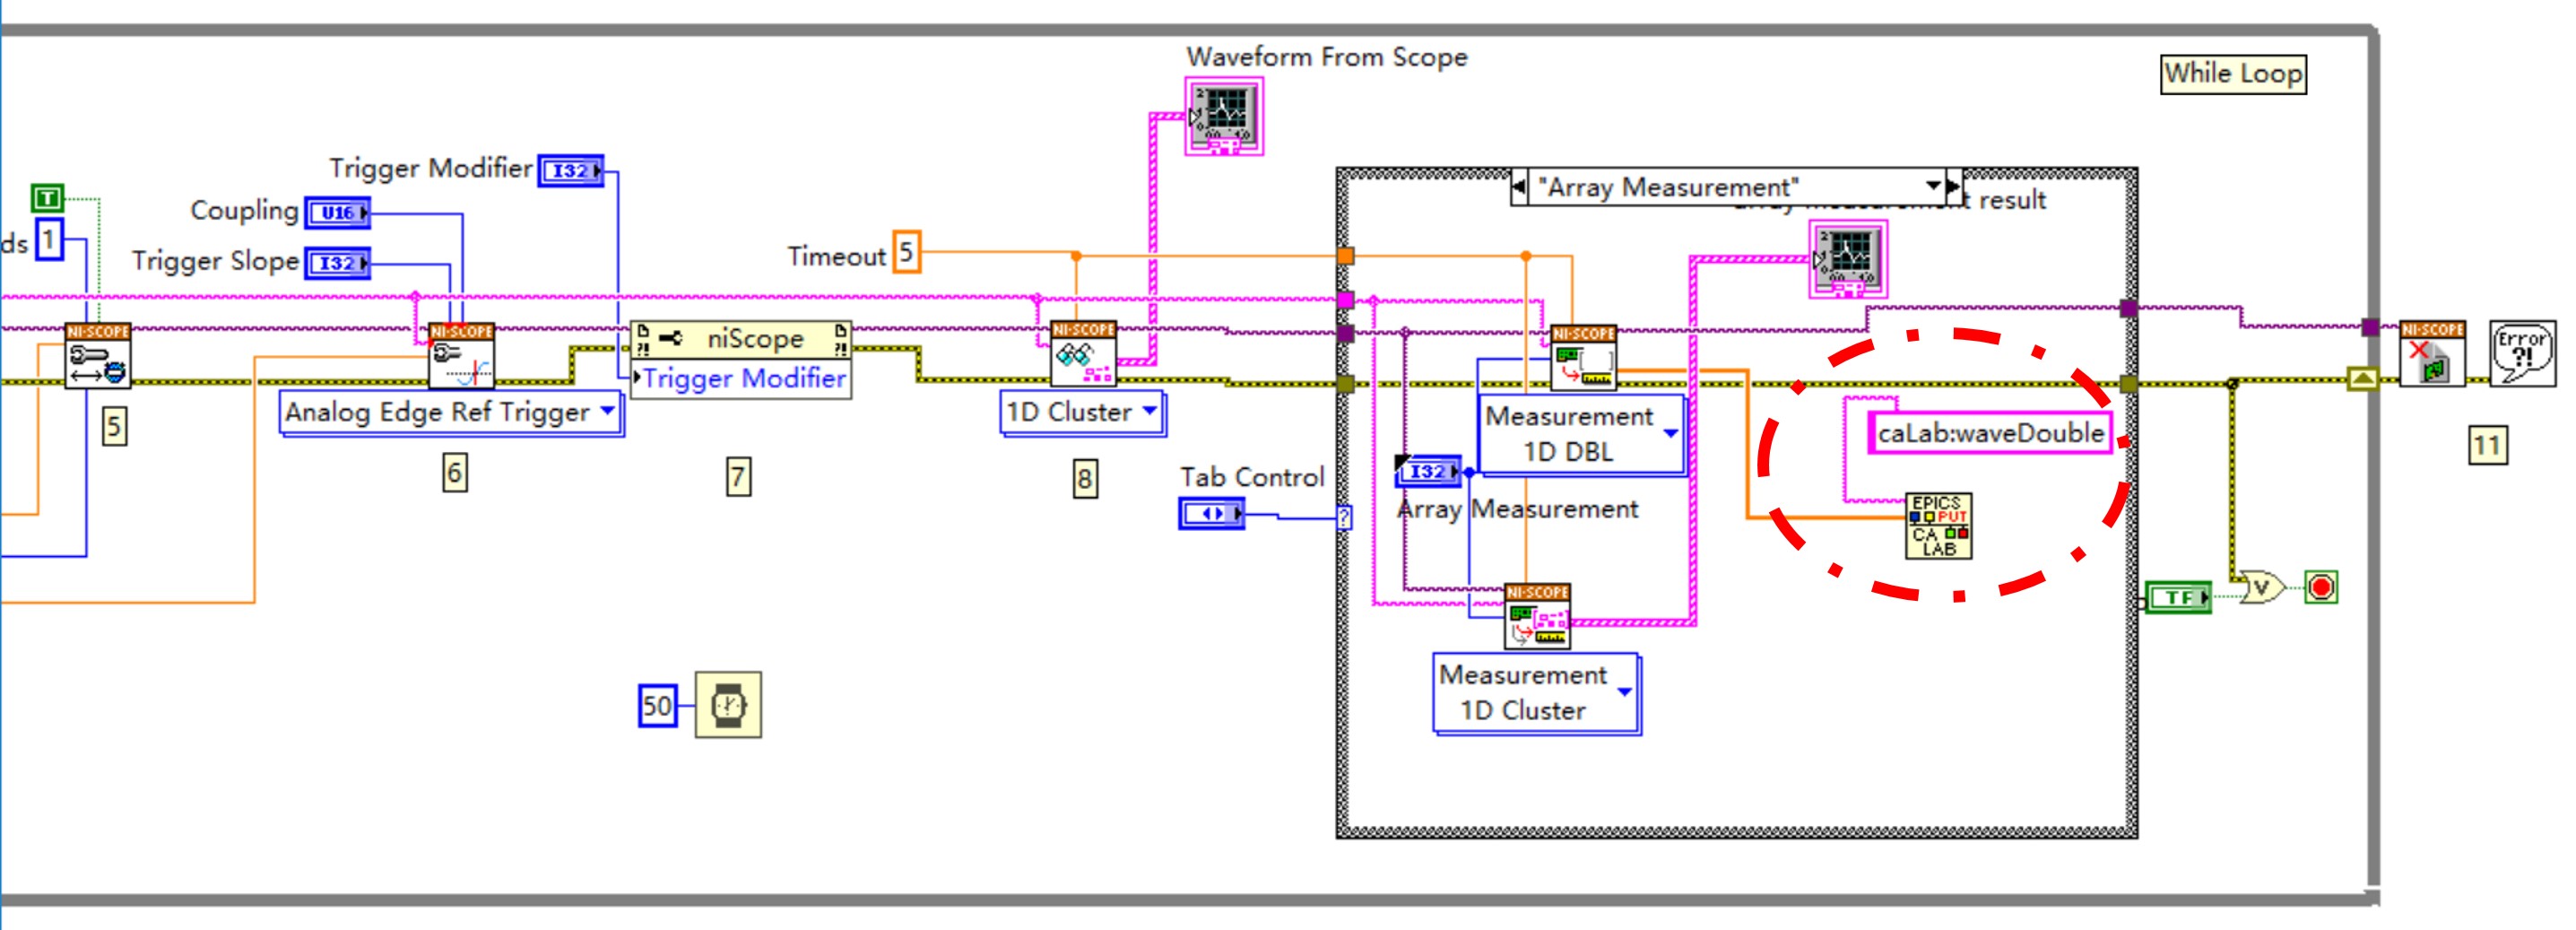
I want to put the signal waveform chart versus time to my PV from labview, and camonitor the PV in epics terminal.
I install Calab software to do this. As can be seen from the screenshot in the attatchment. I could put waveform values (values of Y axis of chart by using NI-Scope widget) to my epics PV ("caLab:waveDouble") by using "Ca Lab epics put " widget marked by red dashed circle.
My problem is that I have no idea how to put time (values of X axis of chart) to another PV by using "Ca Lab epics put " widget or any other methods, so I can camonitor it in epics terminal.
I have attatched the screenshot of labview block diagram in the attatchement, any help will be appreciated and thanks in advance.
Zhefu
|
Attachment:
screenshot.jpg
Description: screenshot.jpg
- Replies:
- Question about epics/Labview and Ca Lab -- how to put time to my PV from signal waveform chart in labview. lzf neu
- Navigate by Date:
- Prev: Re: save array of floats into HDF5 as attribute Hinko Kocevar
- Next: RE: save array of floats into HDF5 as attribute tom.cobb
- Index: 1994 1995 1996 1997 1998 1999 2000 2001 2002 2003 2004 2005 2006 2007 2008 2009 2010 2011 2012 2013 2014 2015 2016 <2017> 2018 2019 2020 2021 2022 2023 2024
- Navigate by Thread:
- Prev: RE: save array of floats into HDF5 as attribute tom.cobb
- Next: Question about epics/Labview and Ca Lab -- how to put time to my PV from signal waveform chart in labview. lzf neu
- Index: 1994 1995 1996 1997 1998 1999 2000 2001 2002 2003 2004 2005 2006 2007 2008 2009 2010 2011 2012 2013 2014 2015 2016 <2017> 2018 2019 2020 2021 2022 2023 2024
· Search · EPICS V4 · IRMIS · Talk · Bugs · Documents · Links · Licensing ·