Experimental Physics and
Industrial Control System
| 1994 1995 1996 1997 1998 1999 2000 2001 2002 2003 2004 2005 2006 2007 <2008> 2009 2010 2011 2012 2013 2014 2015 2016 2017 2018 2019 2020 2021 2022 2023 2024 | Index | 1994 1995 1996 1997 1998 1999 2000 2001 2002 2003 2004 2005 2006 2007 <2008> 2009 2010 2011 2012 2013 2014 2015 2016 2017 2018 2019 2020 2021 2022 2023 2024 |
| <== Date ==> | <== Thread ==> |
|---|
| Subject: | edm |
| From: | "Szalata, Zenon M." <[email protected]> |
| To: | "EPICS Techtalk" <[email protected]> |
| Date: | Fri, 29 Feb 2008 16:23:14 -0800 |
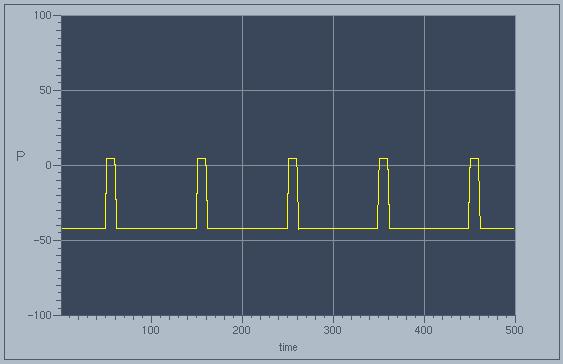
I am again struggling with edm.  I am trying to setup a X-Y graph to my liking and am greatly defeated.  I do not seem to be able to control the gridlines.  I am attaching a snapshot of my graph.  Why is the vertical grid line at x=100 missing?  How can I achieve having a vertical grid line every 50 points?  How can I achieve having a horizontal gridline every 25 points?  I do not want change either the x or the y scale.  In other words I would like to have on the picture shown, 9 vertical gridlines (at 50, 100, etc) and 7 horizontal gridlines (at -75, -50, etc.).  Can this be done?  Can someone offer a solution?
Many thanks in advance,
Zen
Attachment:
xygraph.jpg
Description: xygraph.jpg
- Navigate by Date:
- Prev: Re: Initialize multi-element field Maren Purves
- Next: Re: Record loop issue Tim Mooney
- Index: 1994 1995 1996 1997 1998 1999 2000 2001 2002 2003 2004 2005 2006 2007 <2008> 2009 2010 2011 2012 2013 2014 2015 2016 2017 2018 2019 2020 2021 2022 2023 2024
- Navigate by Thread:
- Prev: Re: Record loop issue Luedeke Andreas
- Next: EDM Szalata, Zenon M.
- Index: 1994 1995 1996 1997 1998 1999 2000 2001 2002 2003 2004 2005 2006 2007 <2008> 2009 2010 2011 2012 2013 2014 2015 2016 2017 2018 2019 2020 2021 2022 2023 2024
· Search · EPICS V4 · IRMIS · Talk · Bugs · Documents · Links · Licensing ·